PulseOps
Screenshots
Real UI captures from the current build.
Home Docs Gallery
Install
Gallery

PulseOps in action.

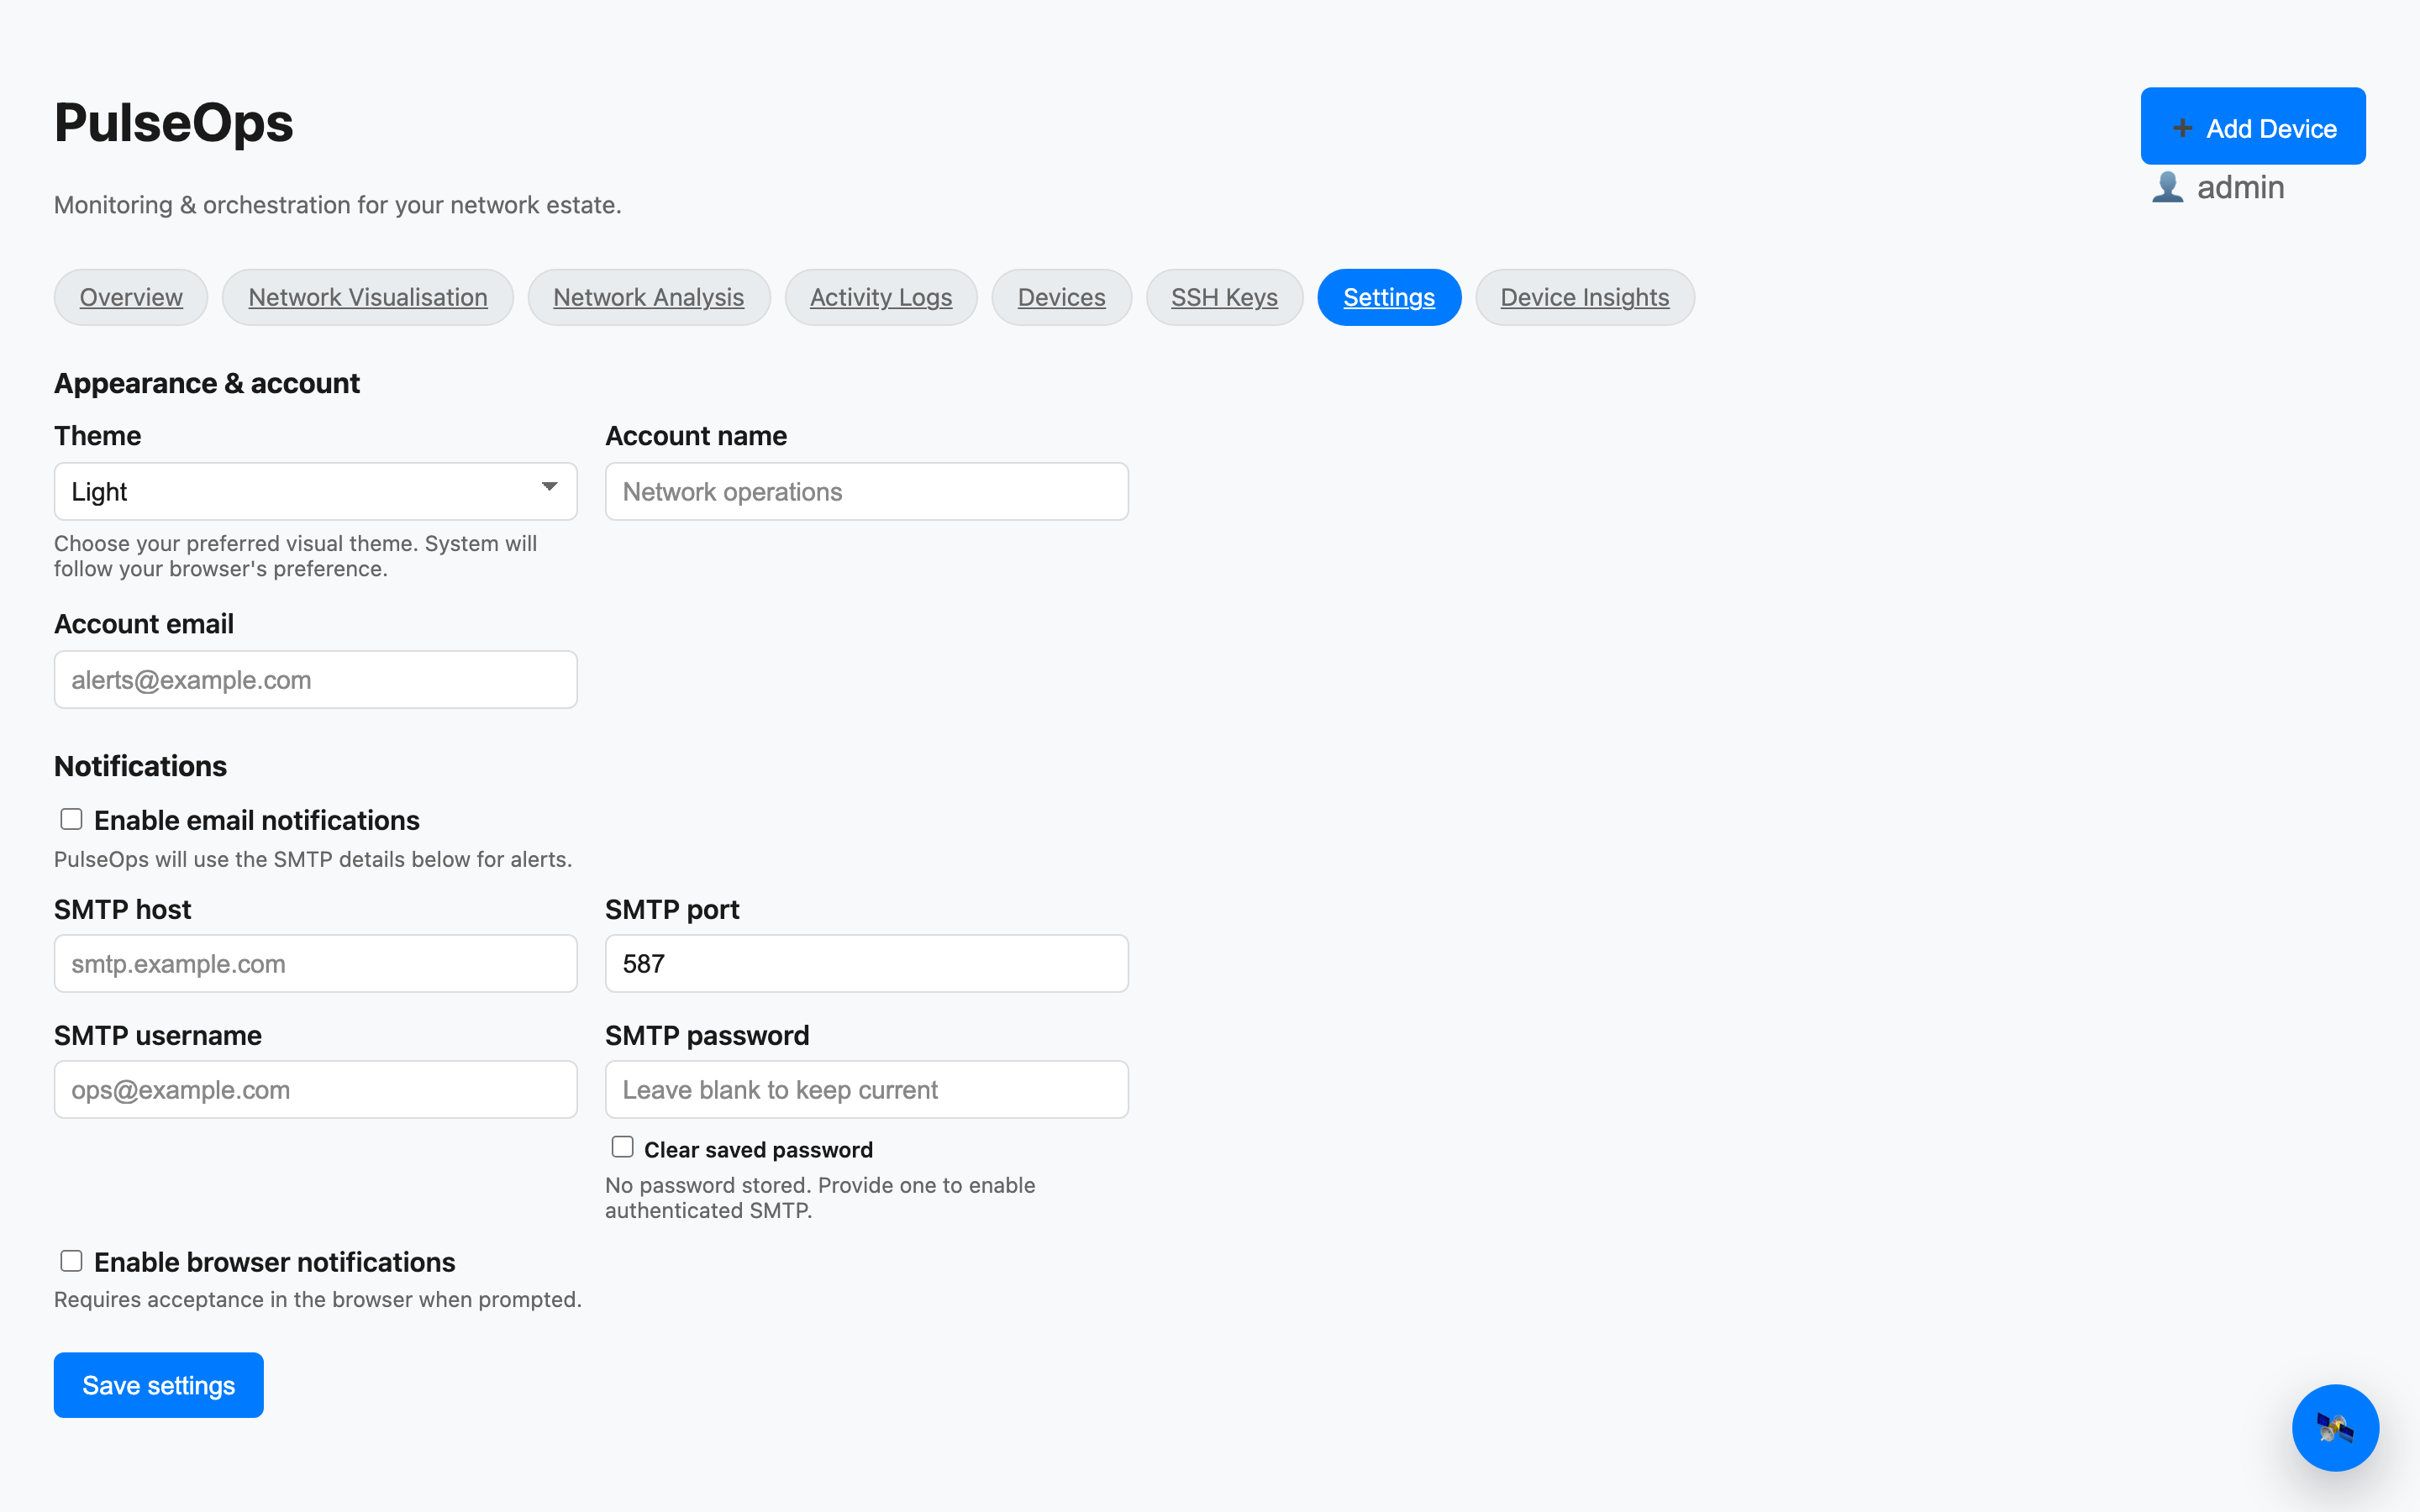
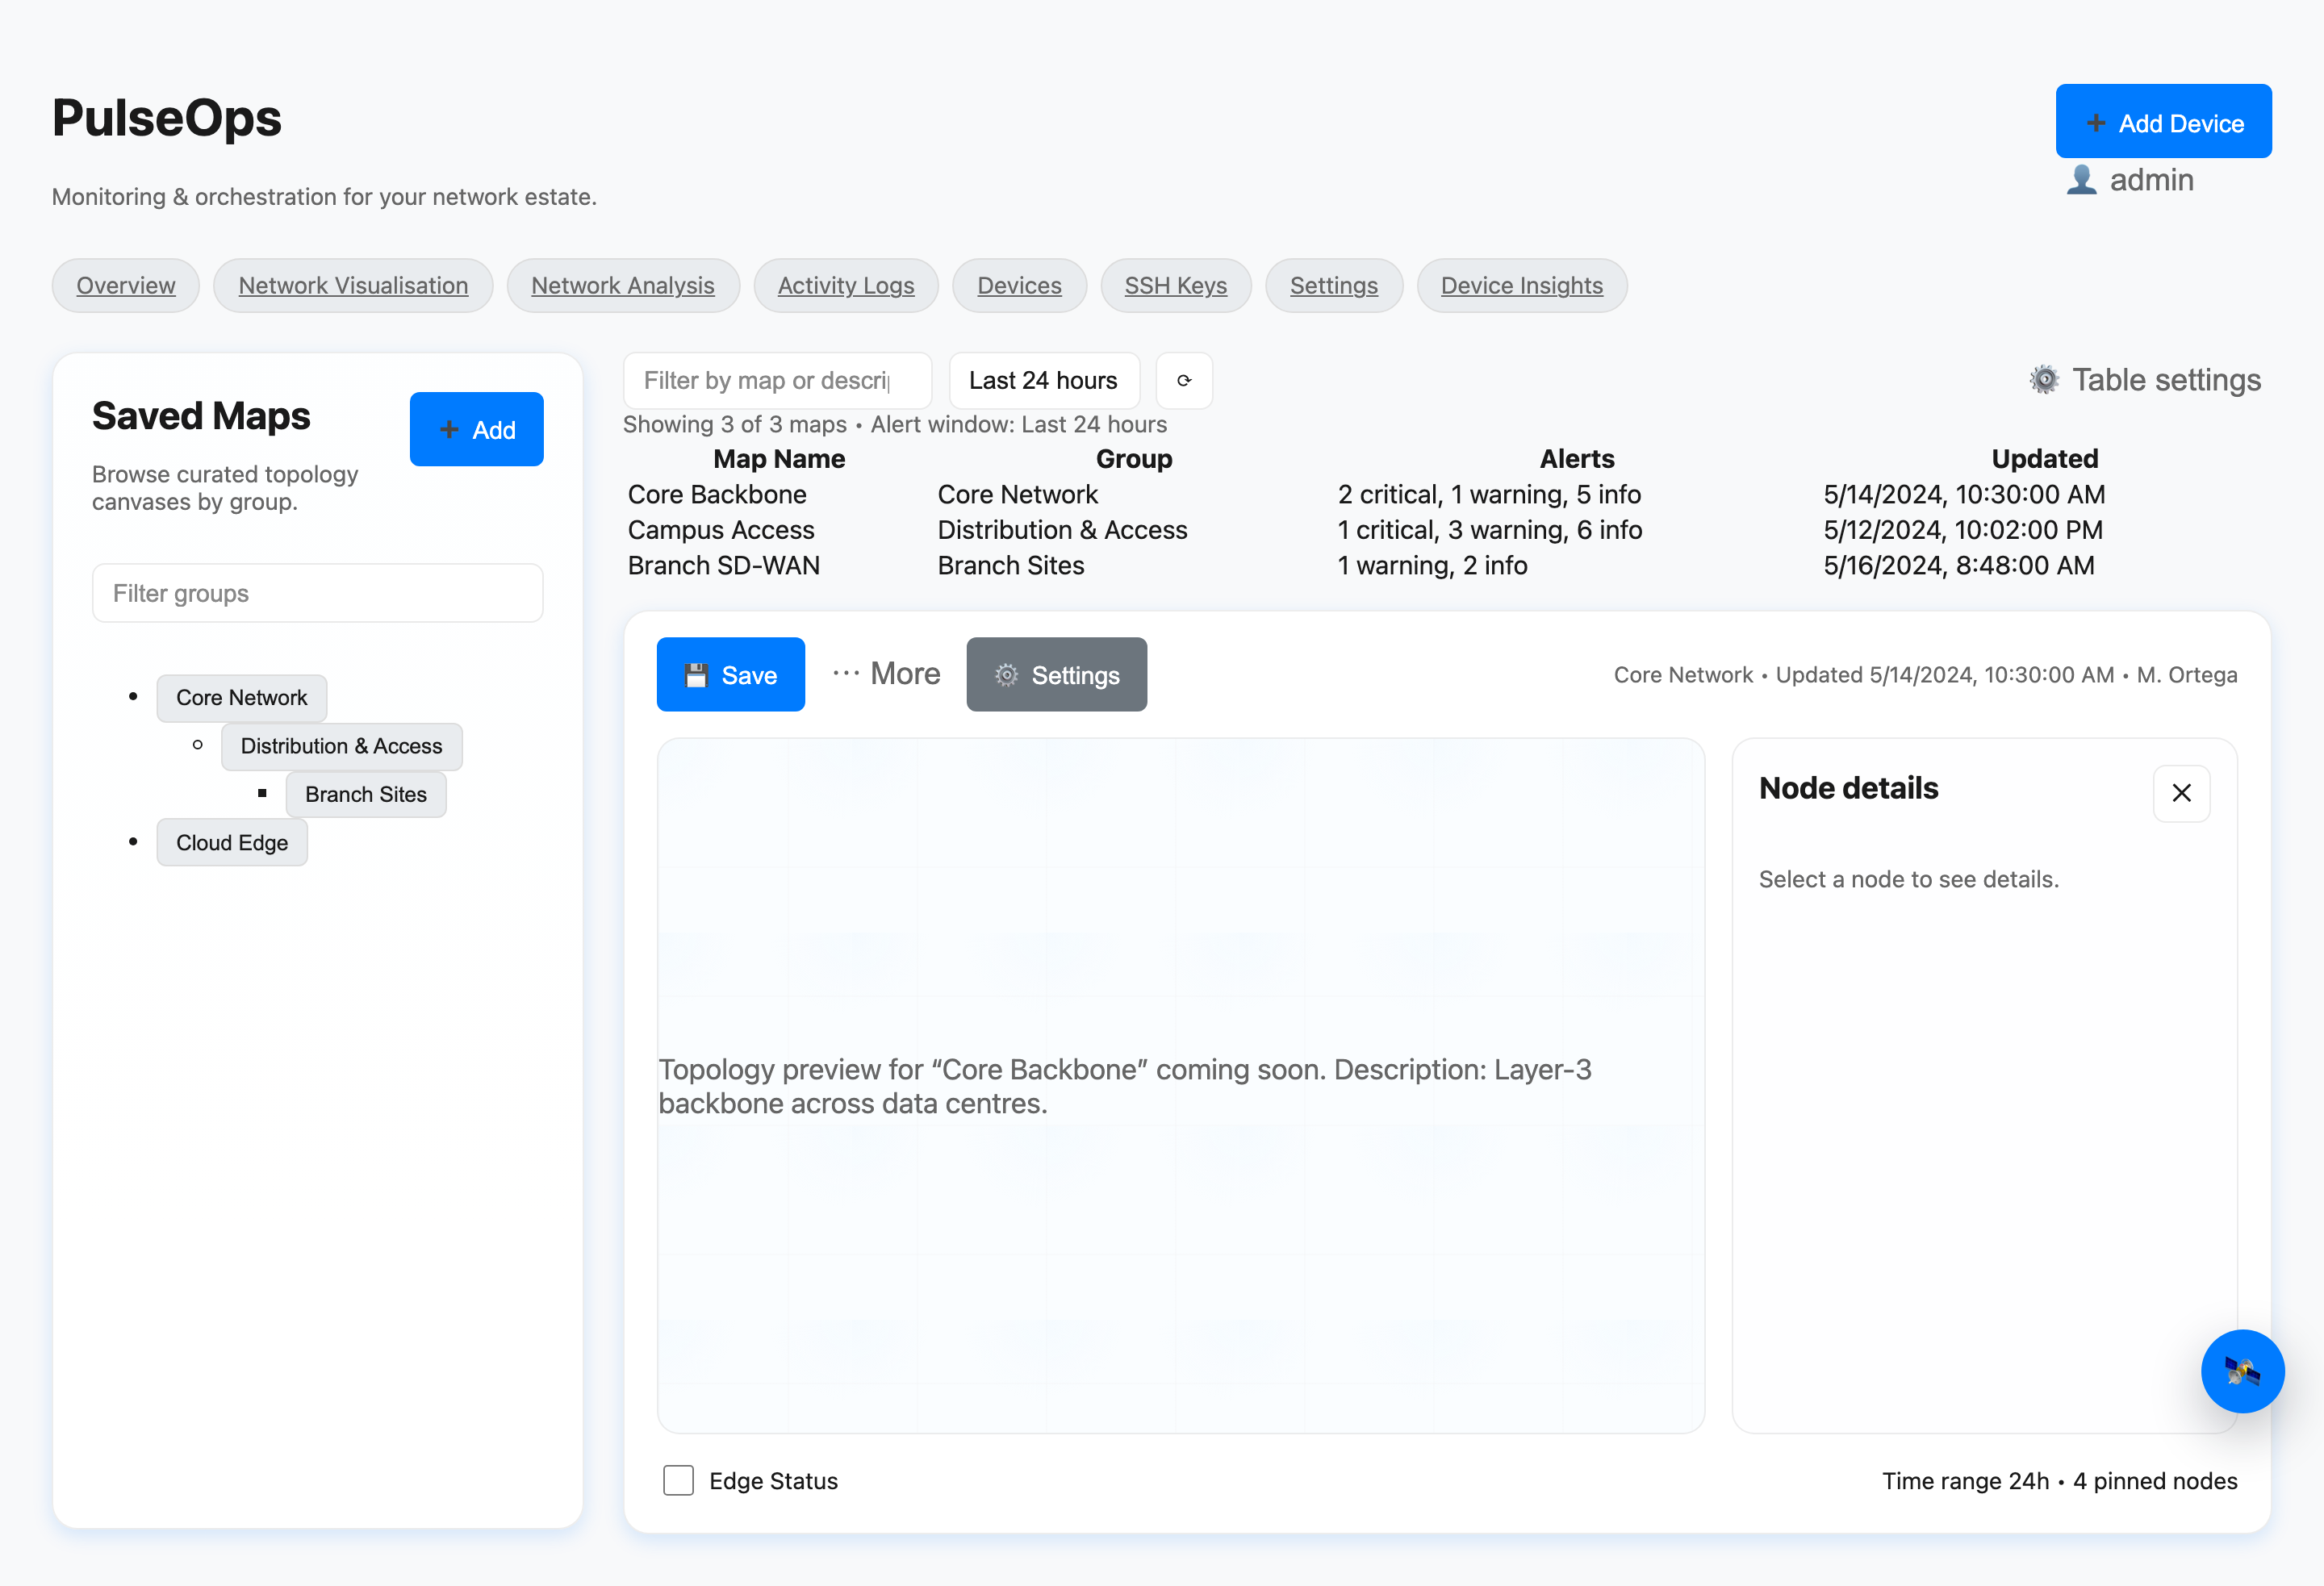
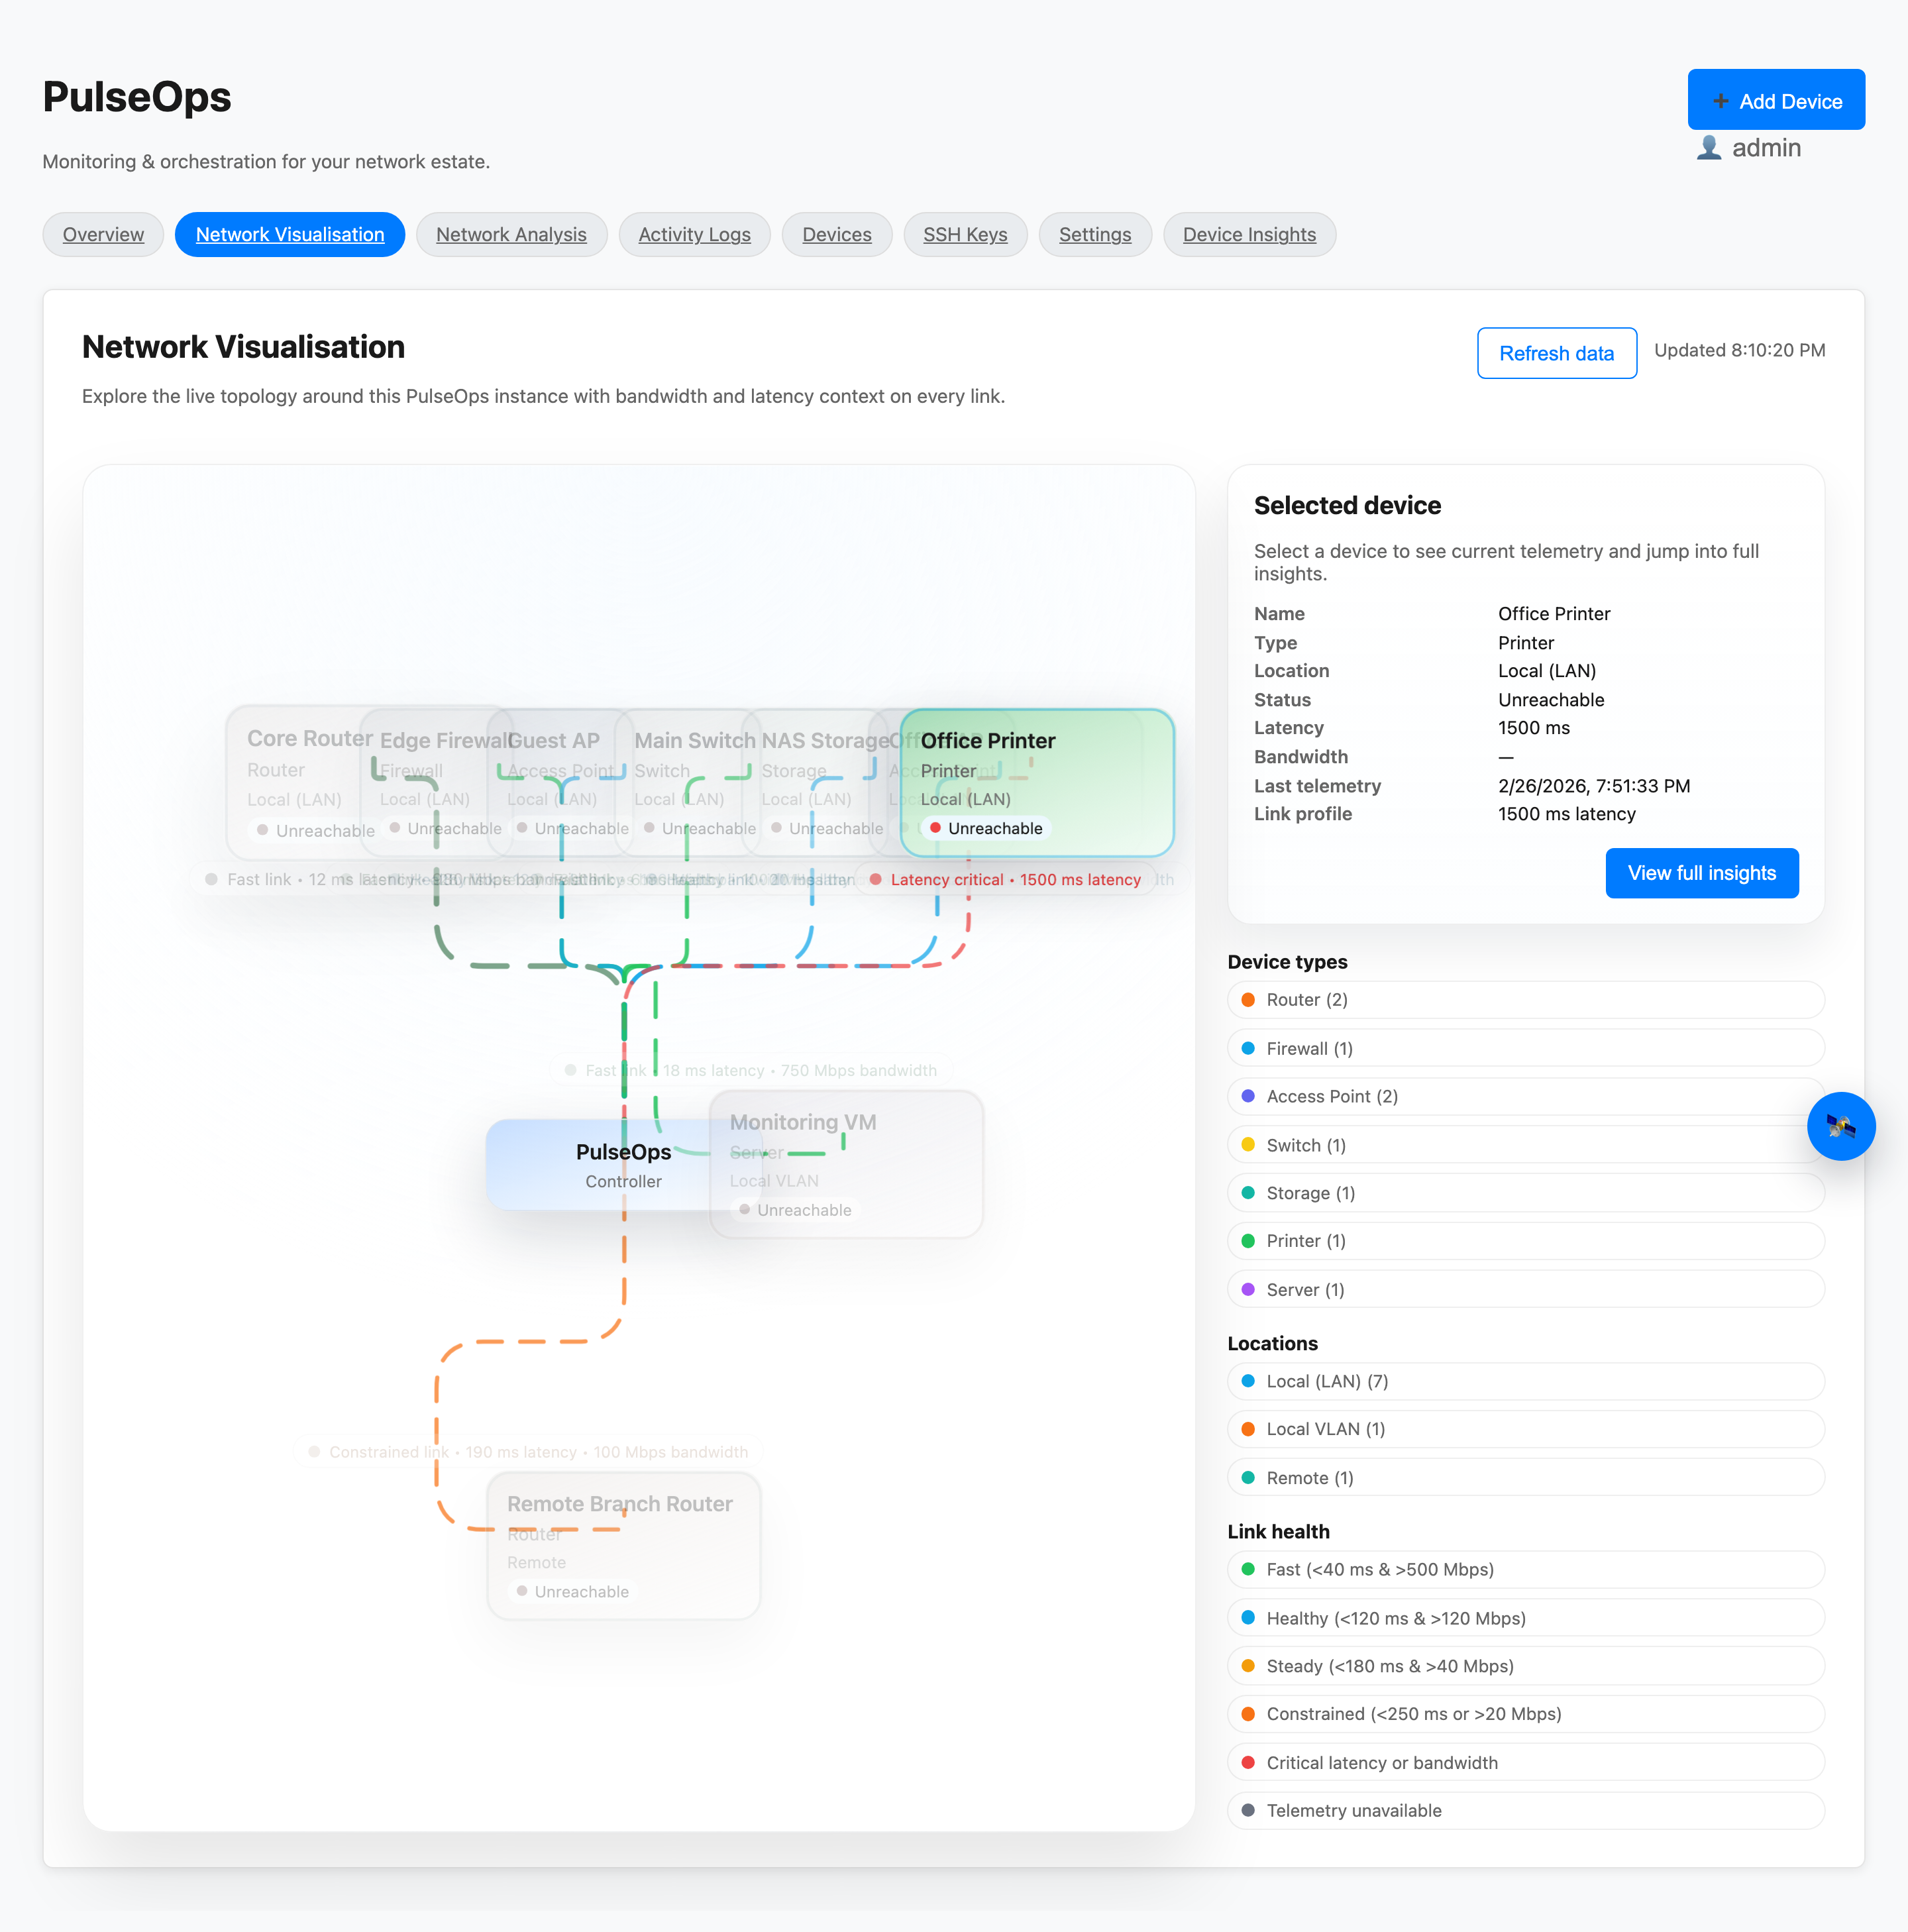
All screenshots captured directly from the live dashboard build. No mockups.

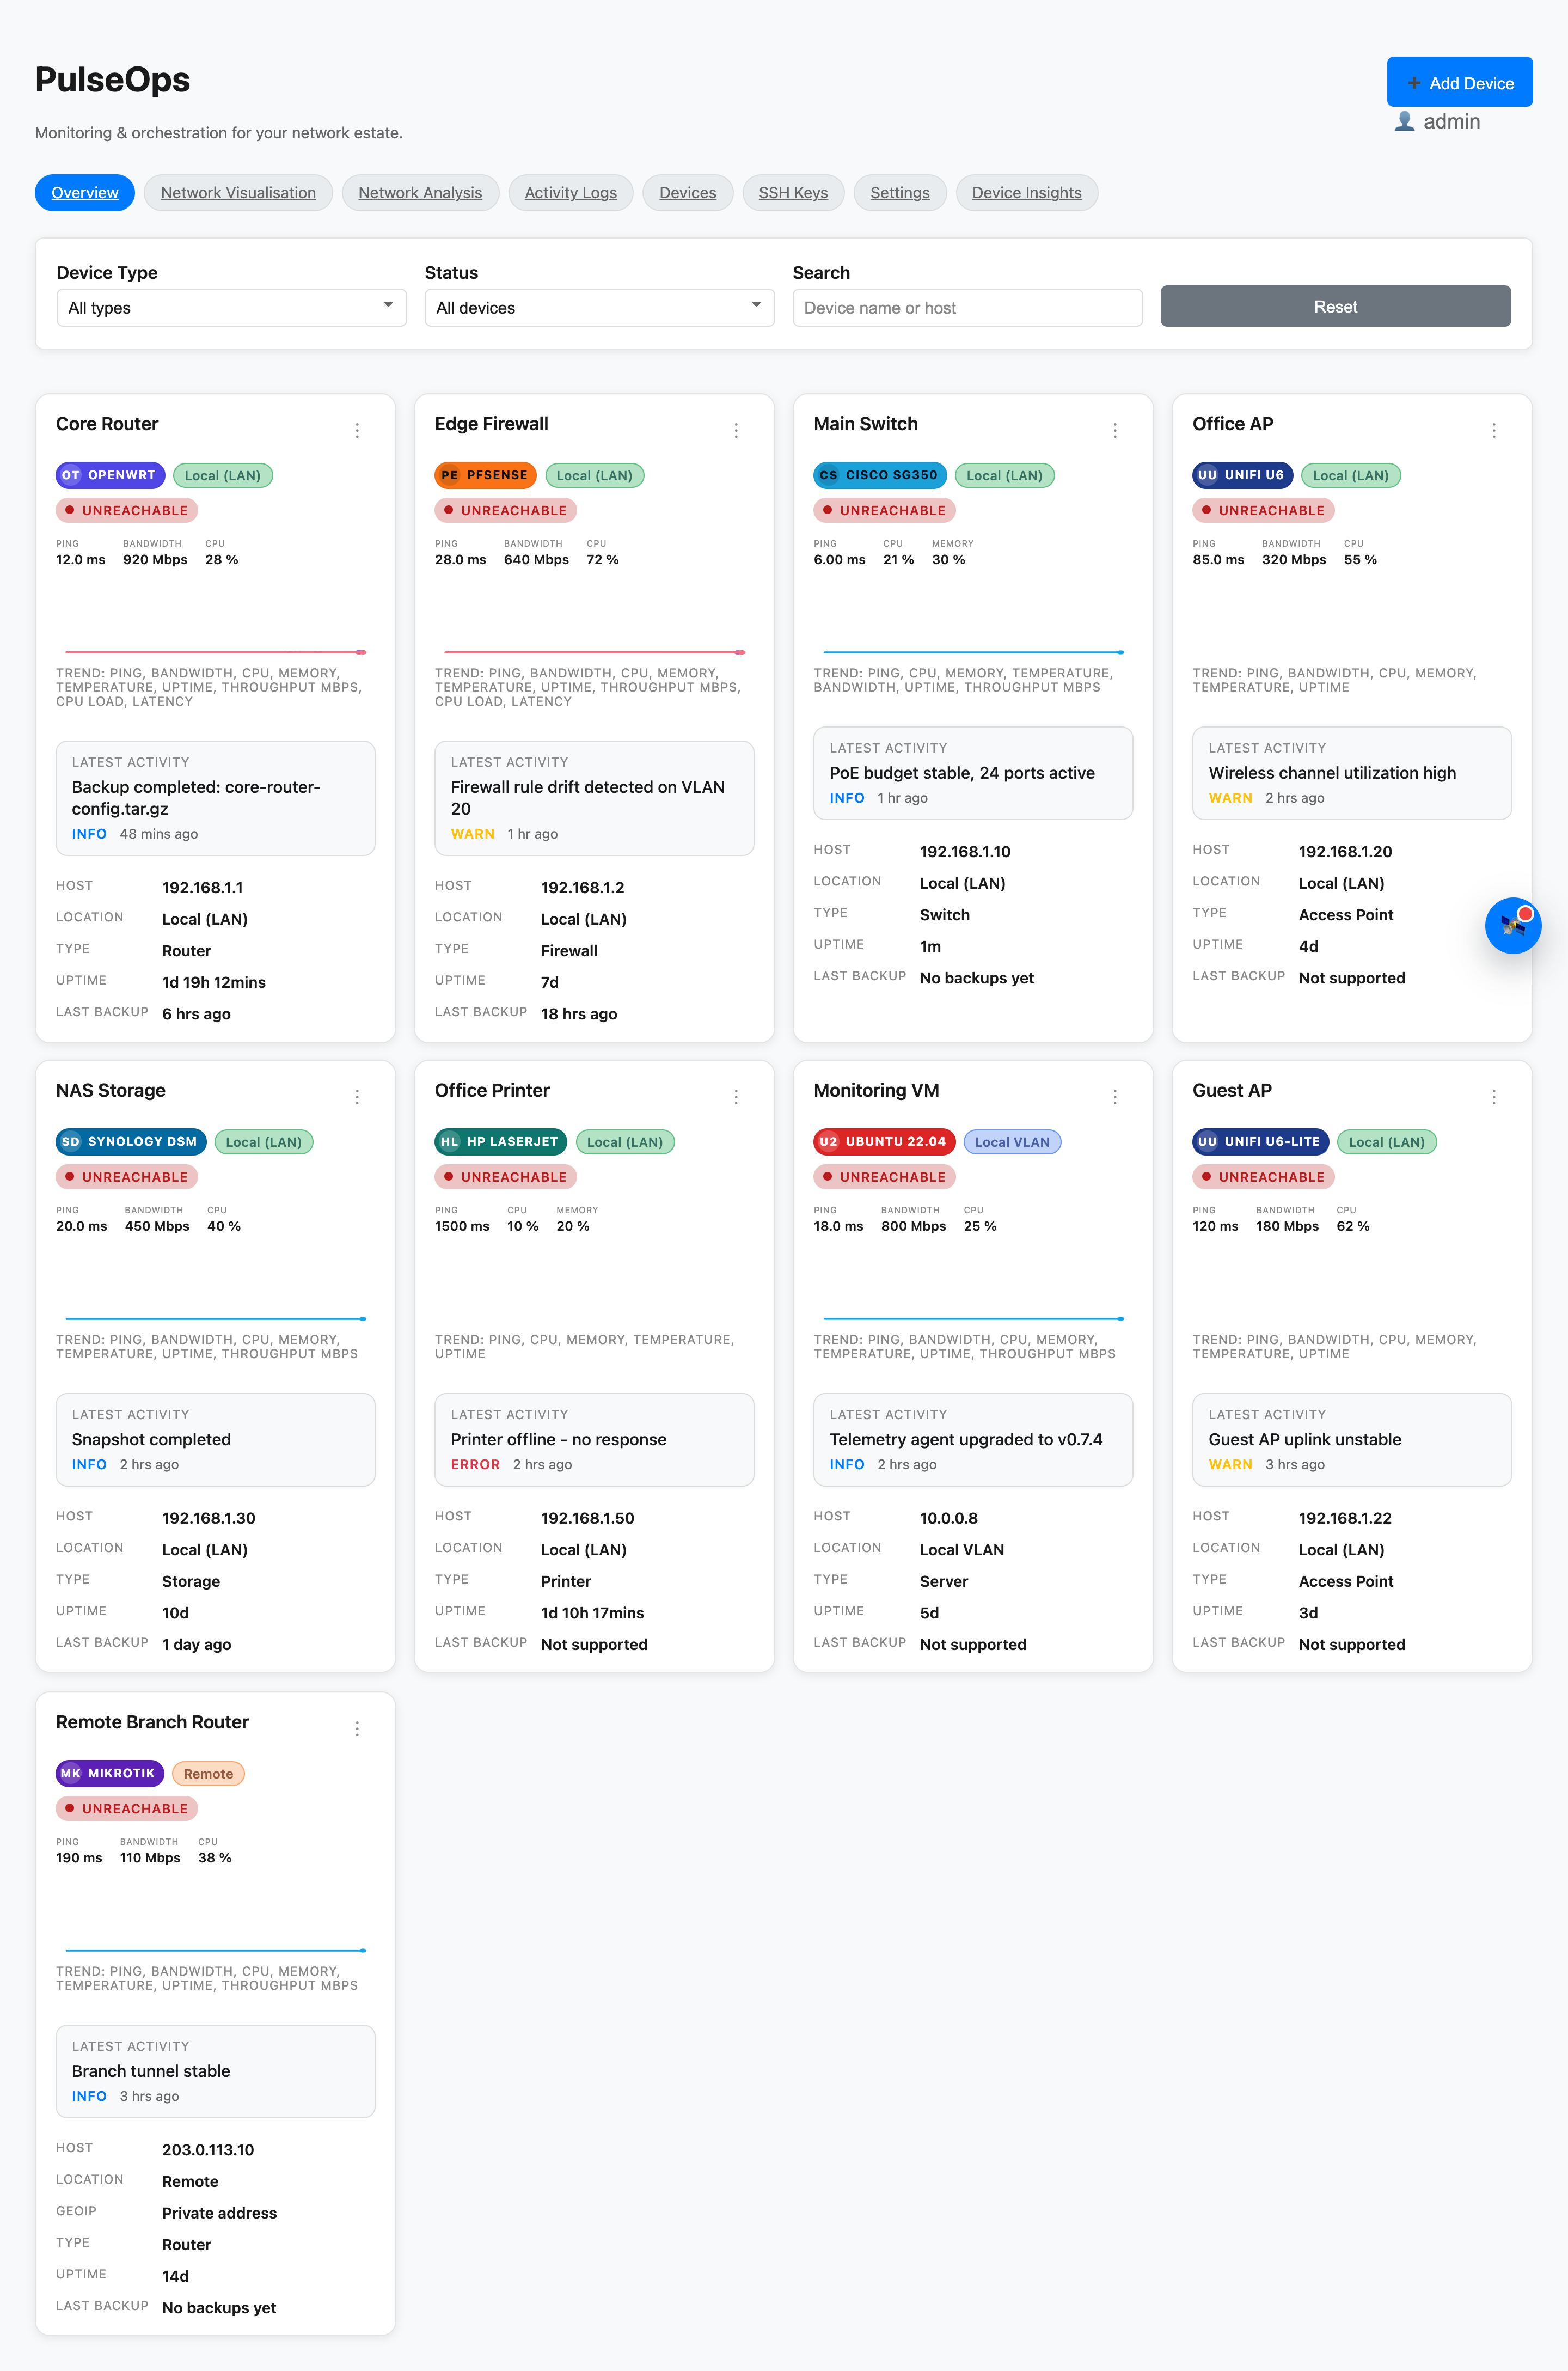
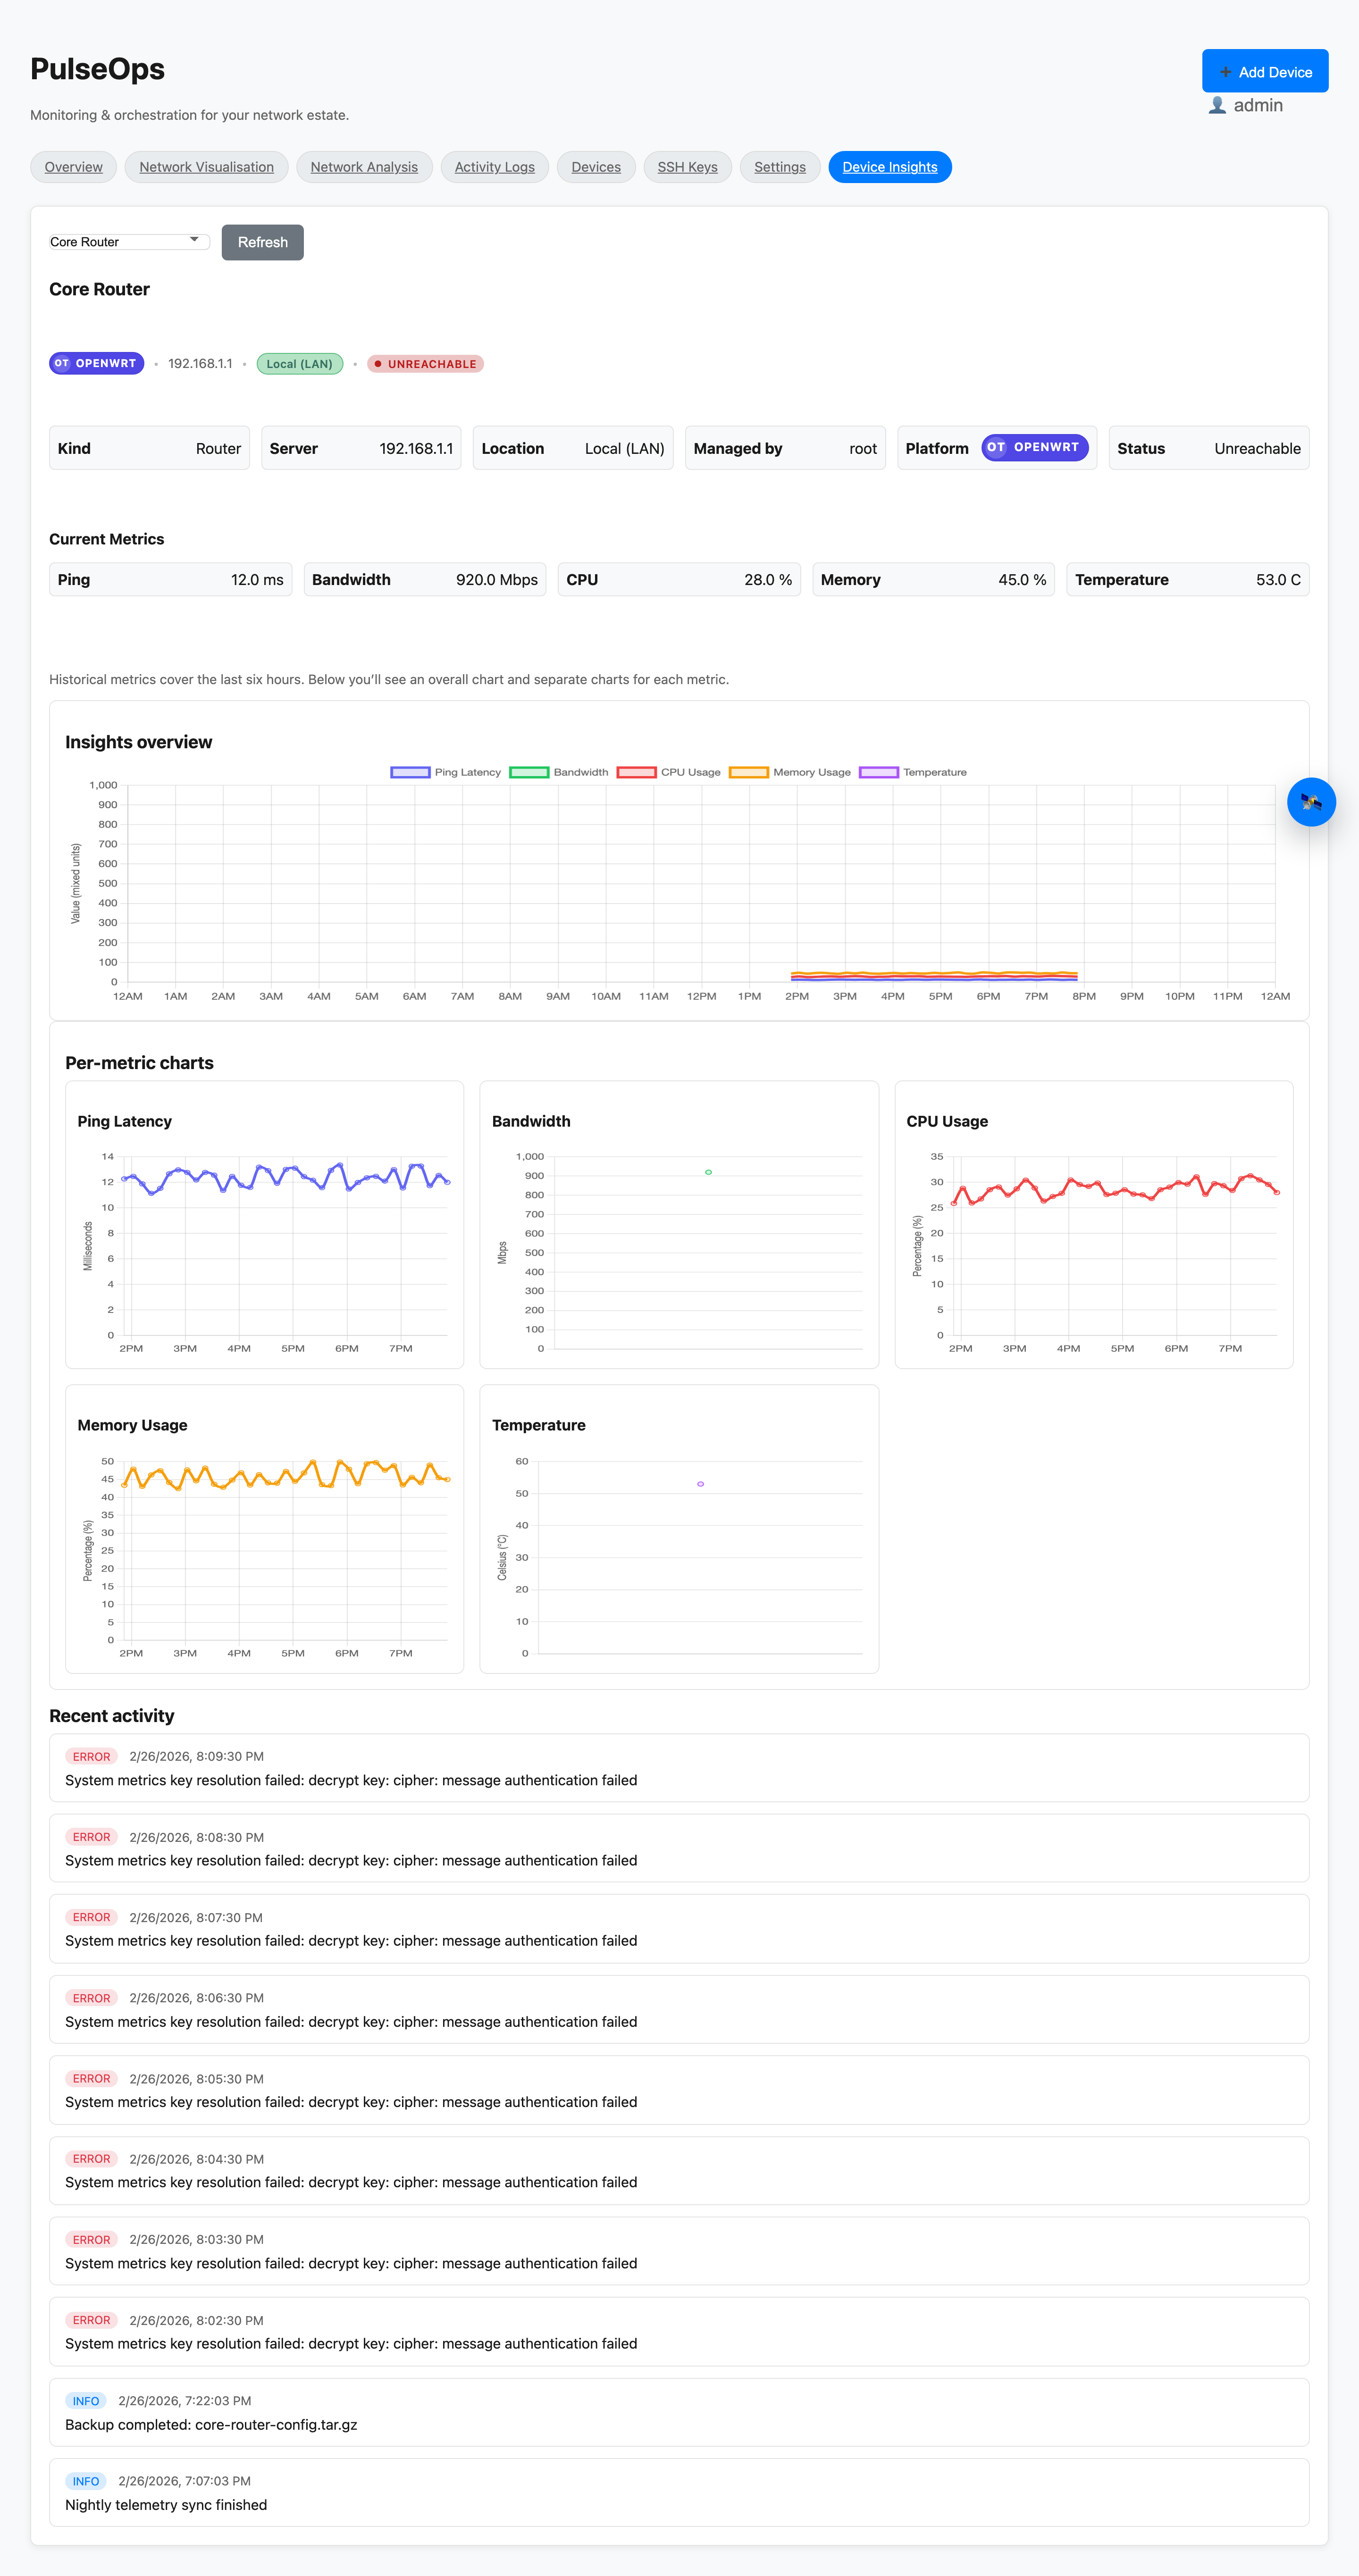
01 — Dashboard + Telemetry
Overview dashboard
Overview — Live device status, ping latency, CPU, memory, and recent activity in a single grid. The primary command view.
Device insights charts
Insights — Per-device time-series charts for latency, CPU, memory, and uptime. Spot trends before they become incidents.
Devices table with actions
Devices — Full inventory table with online/offline status badges, JSON export/import, and per-device action menu (backup, reboot, refresh).
02 — Logs + Activity
Activity logs
Activity Logs — Context-rich event stream filterable by source, device type, device name, severity level, IP range, and free-text search.
Settings panel
Settings — SMTP email alerts and browser notification toggles, theme controls, and account management in a single panel.
03 — Topology + Visualisation
Saved topology maps canvas
Saved Maps — Editable topology canvases with draggable nodes, edge connections, node inspector panel, and PDF export.
Live network visualisation
Network Visualisation — Live topology view with link-health banding, bandwidth and latency context, and device-type legend.
Network analysis scan
Network Analysis — Scan LAN and VLAN ranges, classify devices as local or remote, view summary stats, and push results to inventory.
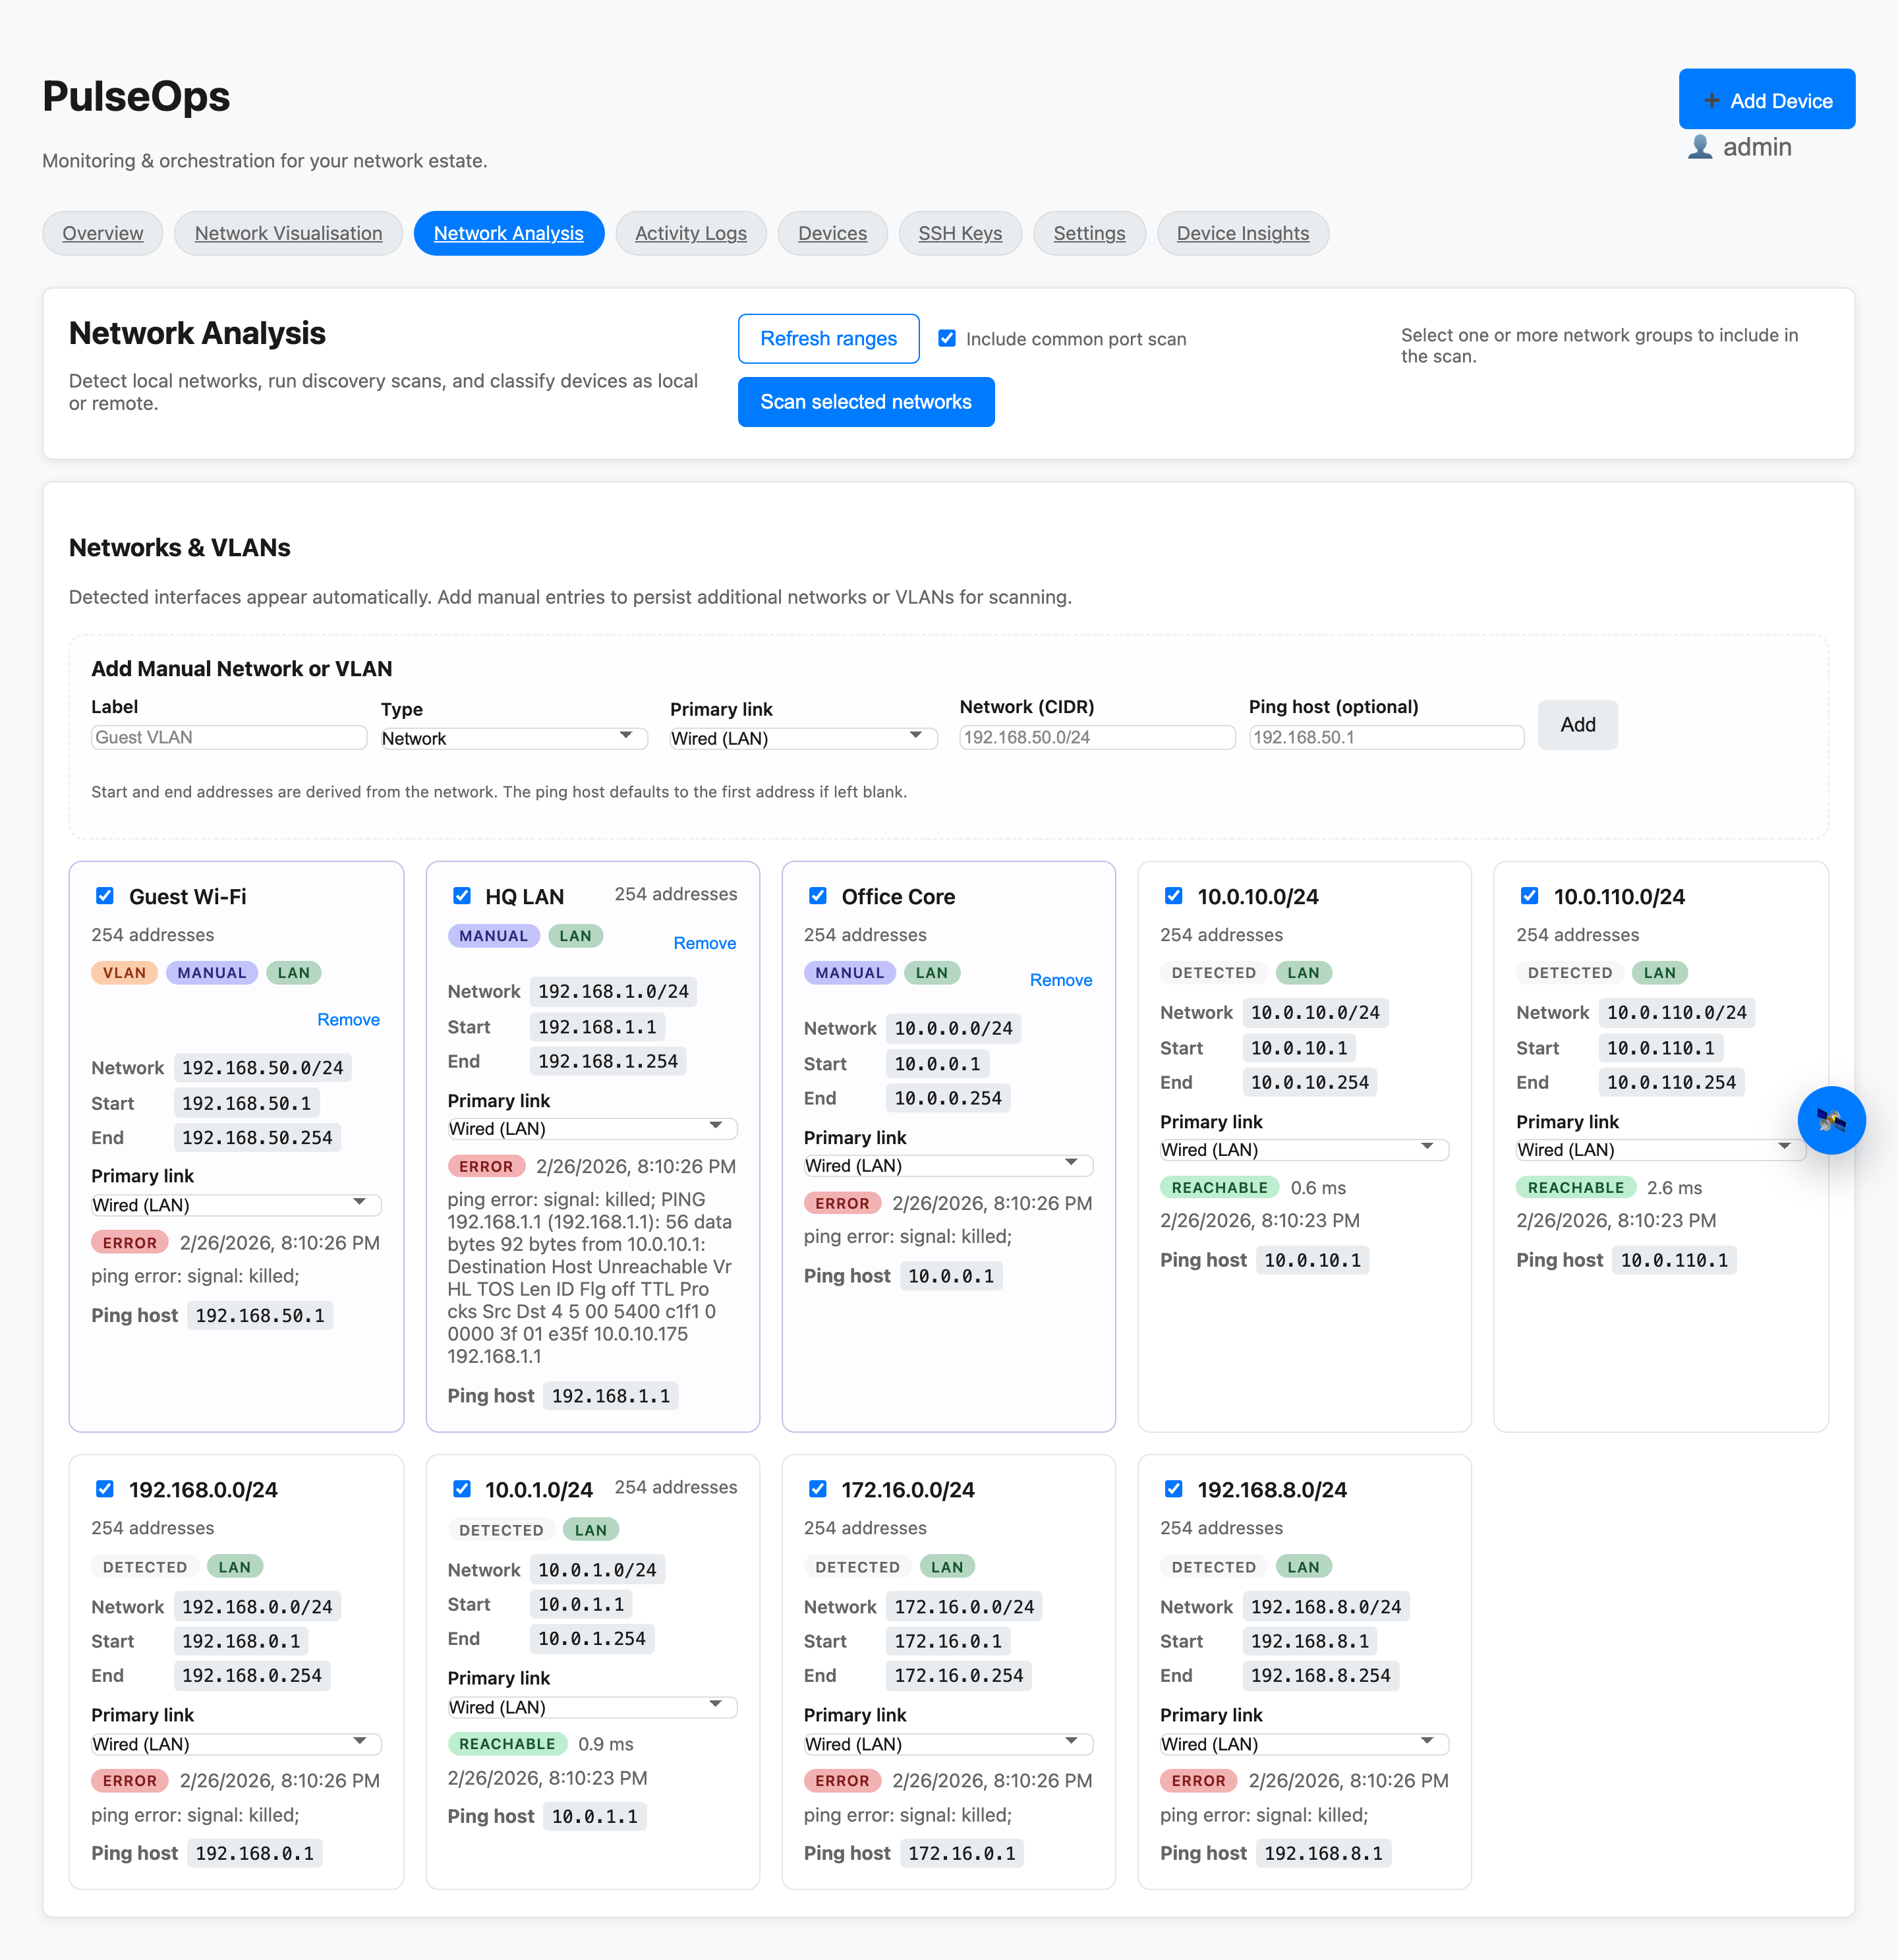
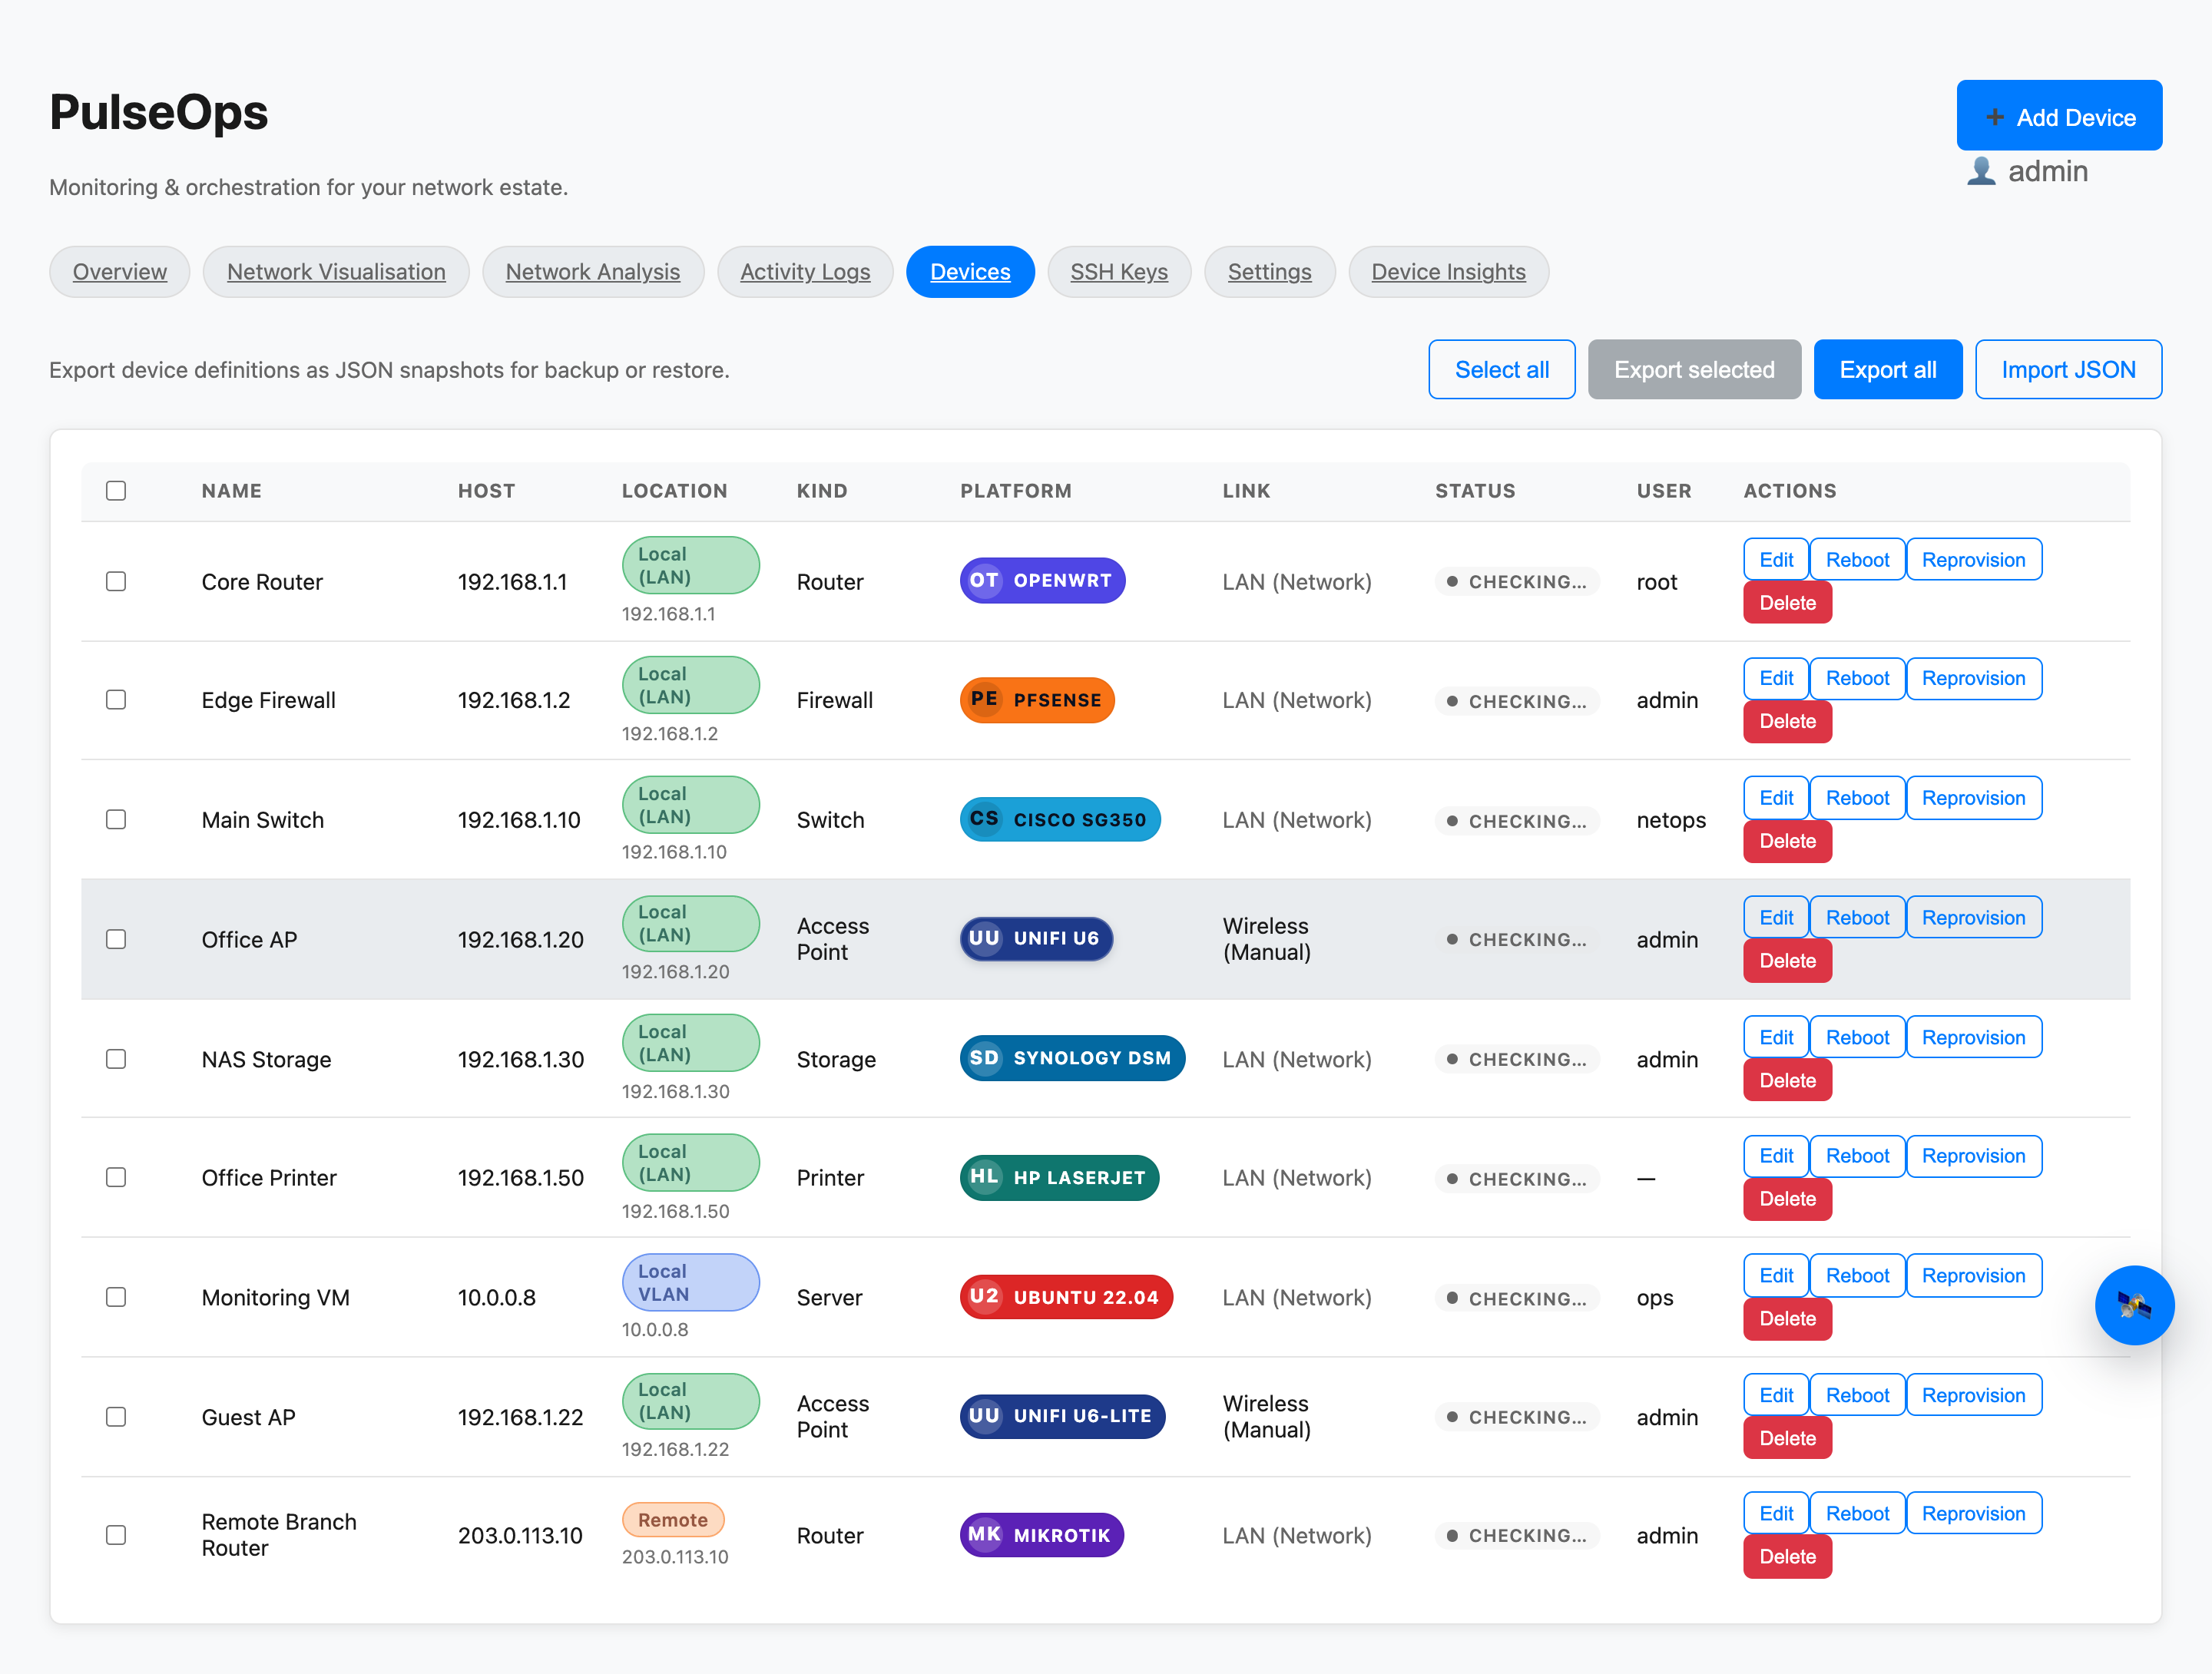
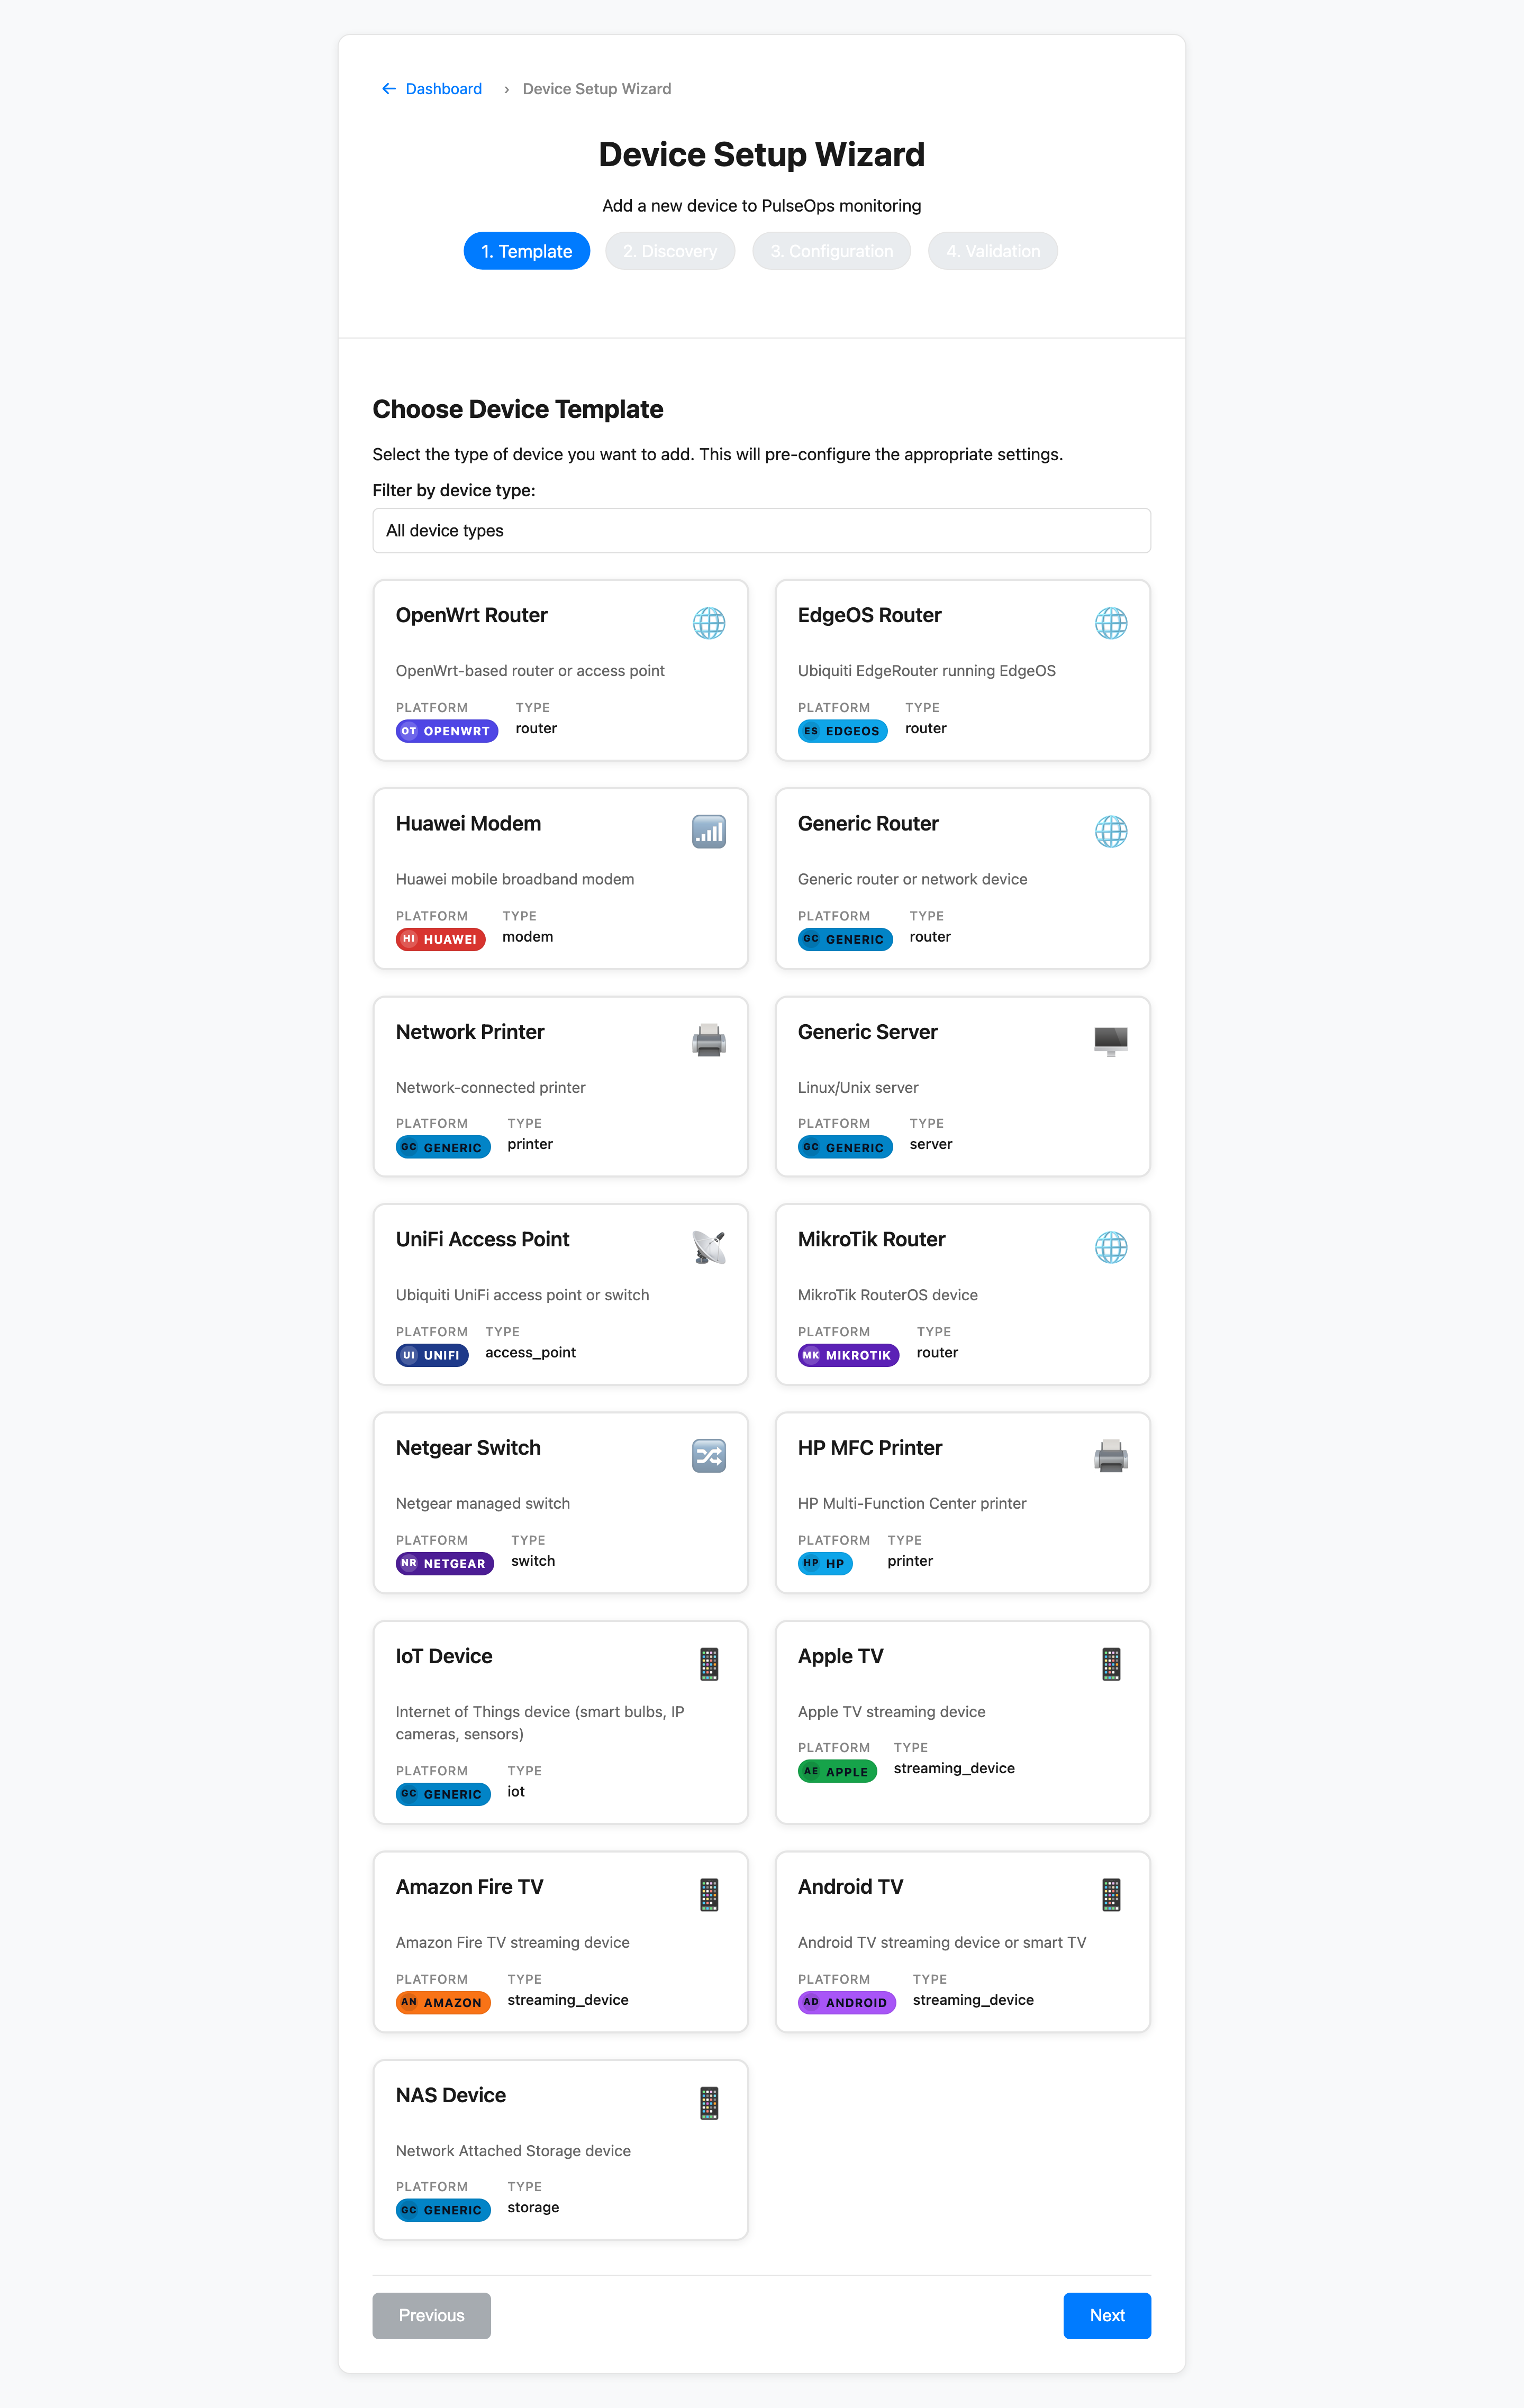
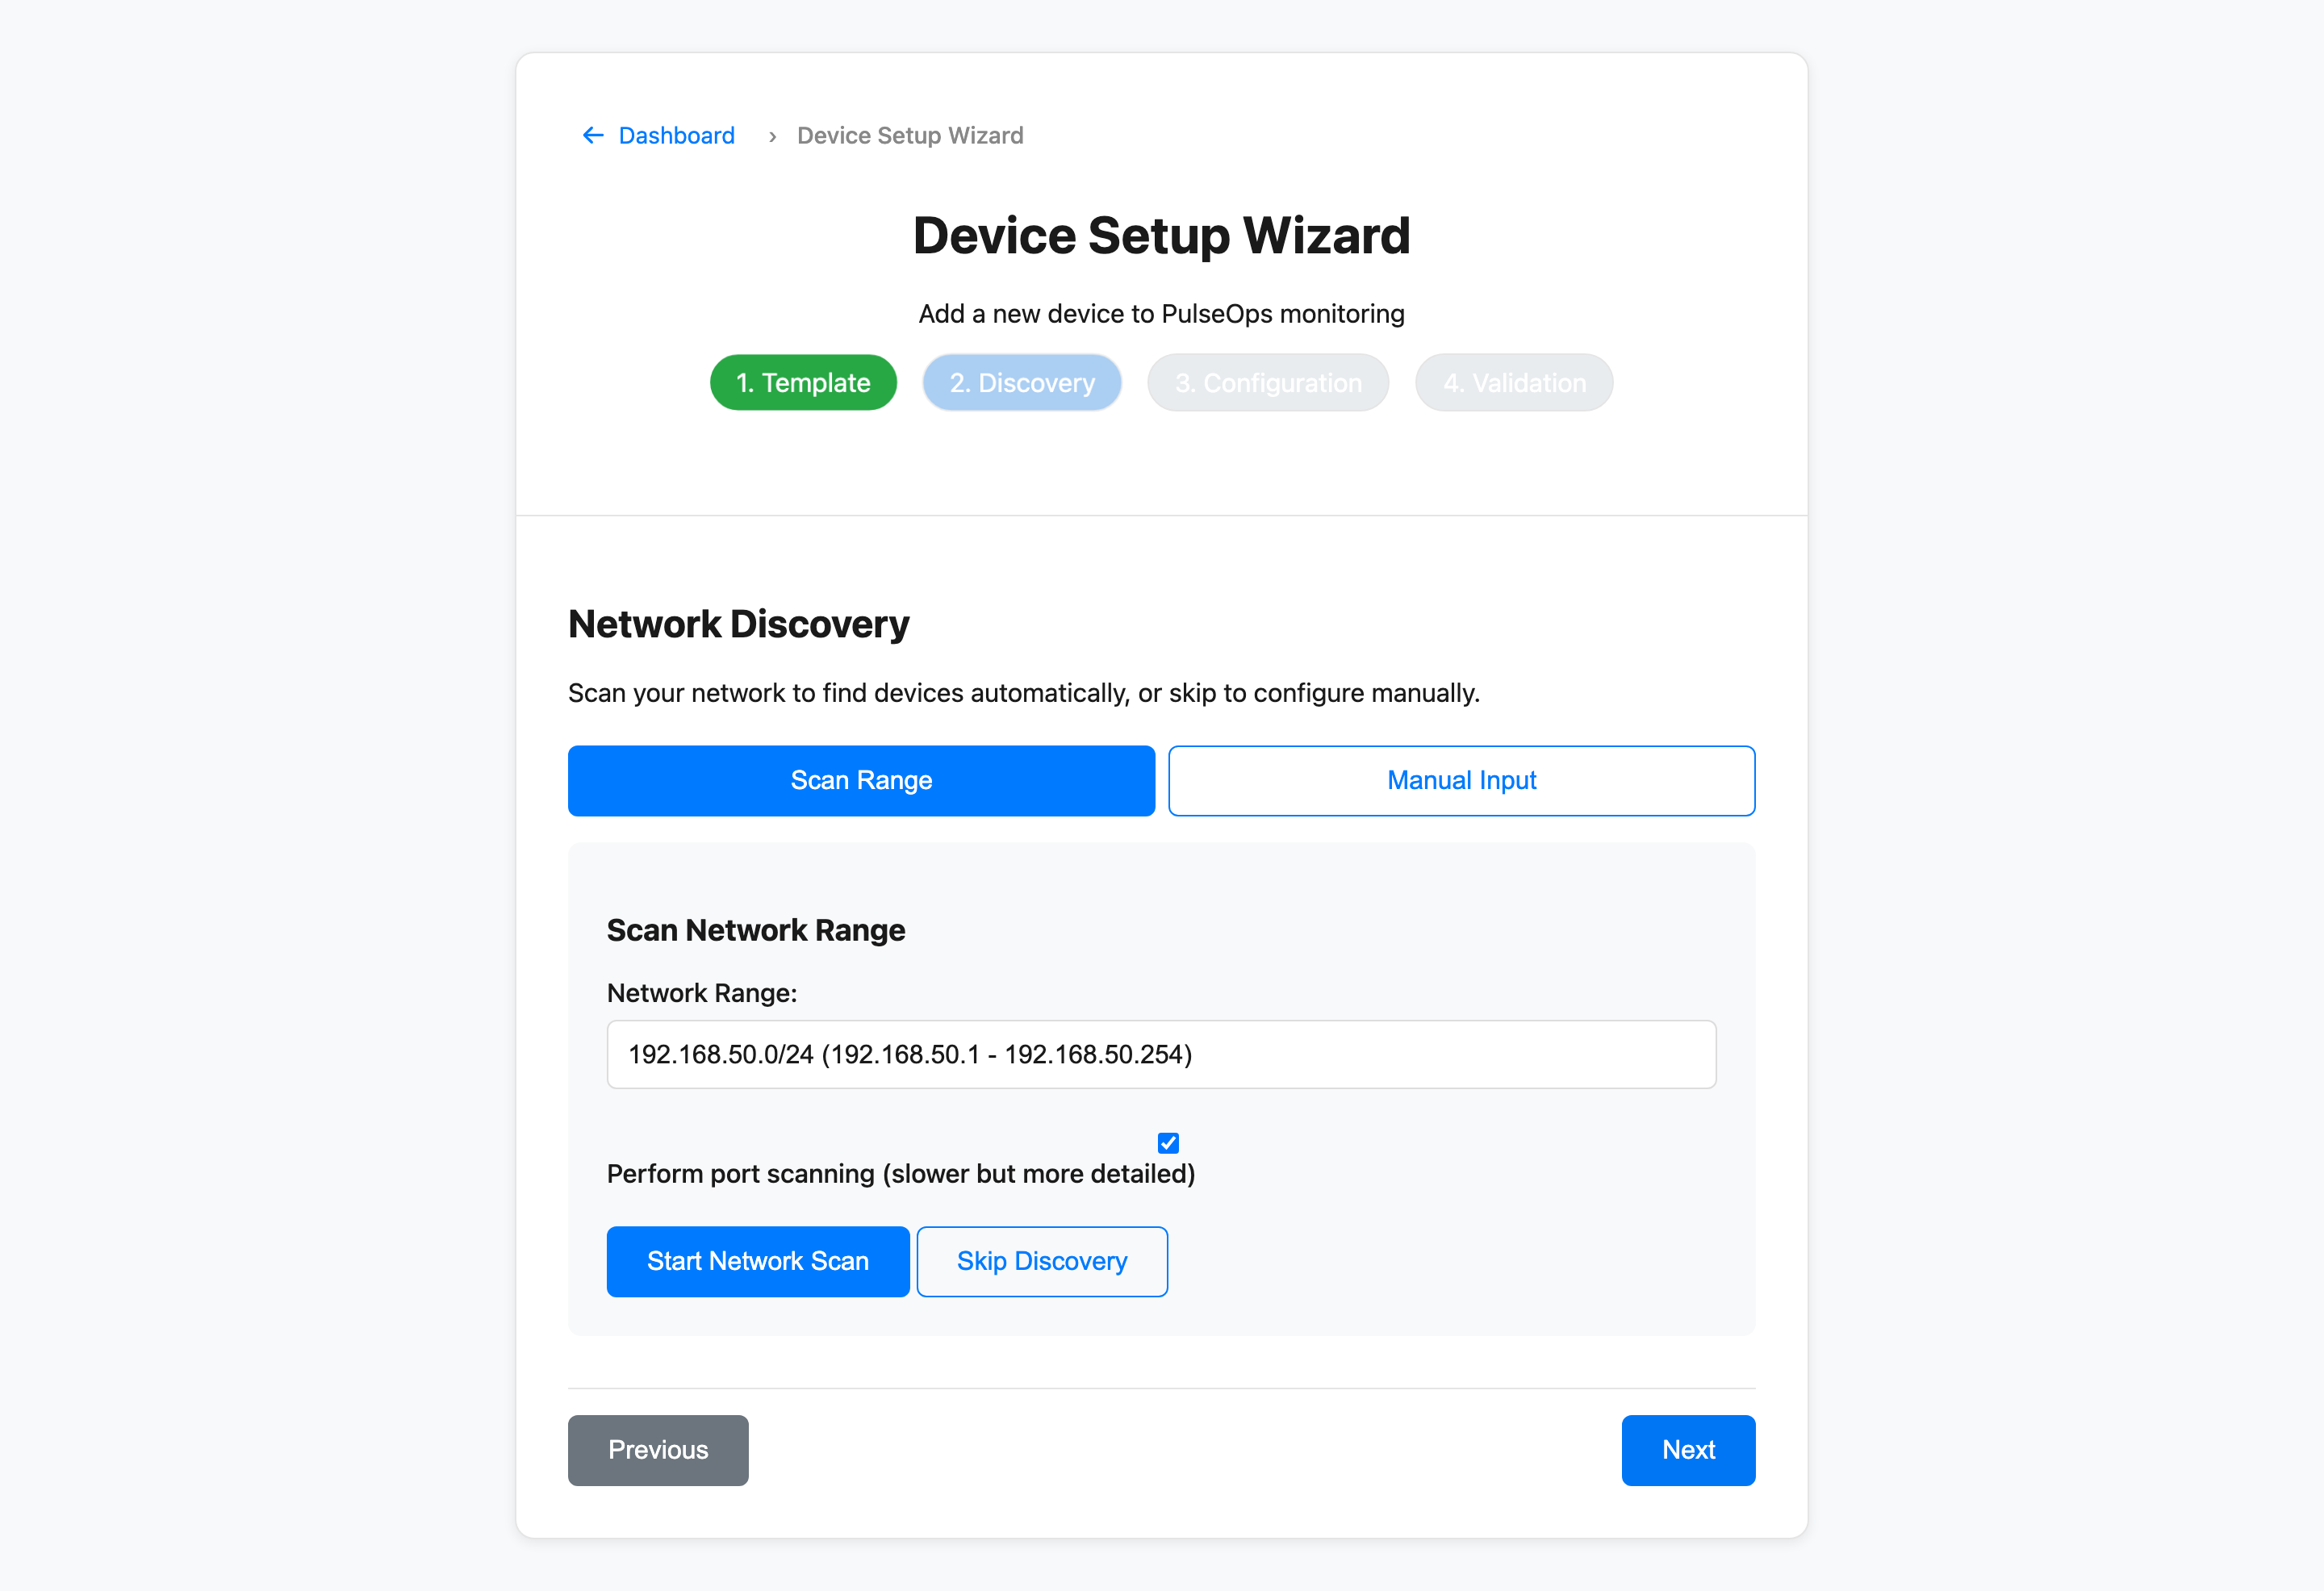
04 — Discovery + Onboarding
Wizard step 1 — template selection
Step 1 — Template — Pick a device type and driver template. Pre-fills defaults for SSH or SNMP credentials and polling intervals.
Wizard step 2 — discovery
Step 2 — Discovery — Enter IP ranges for auto-discovery or add hosts manually. Validates connectivity before committing to inventory.
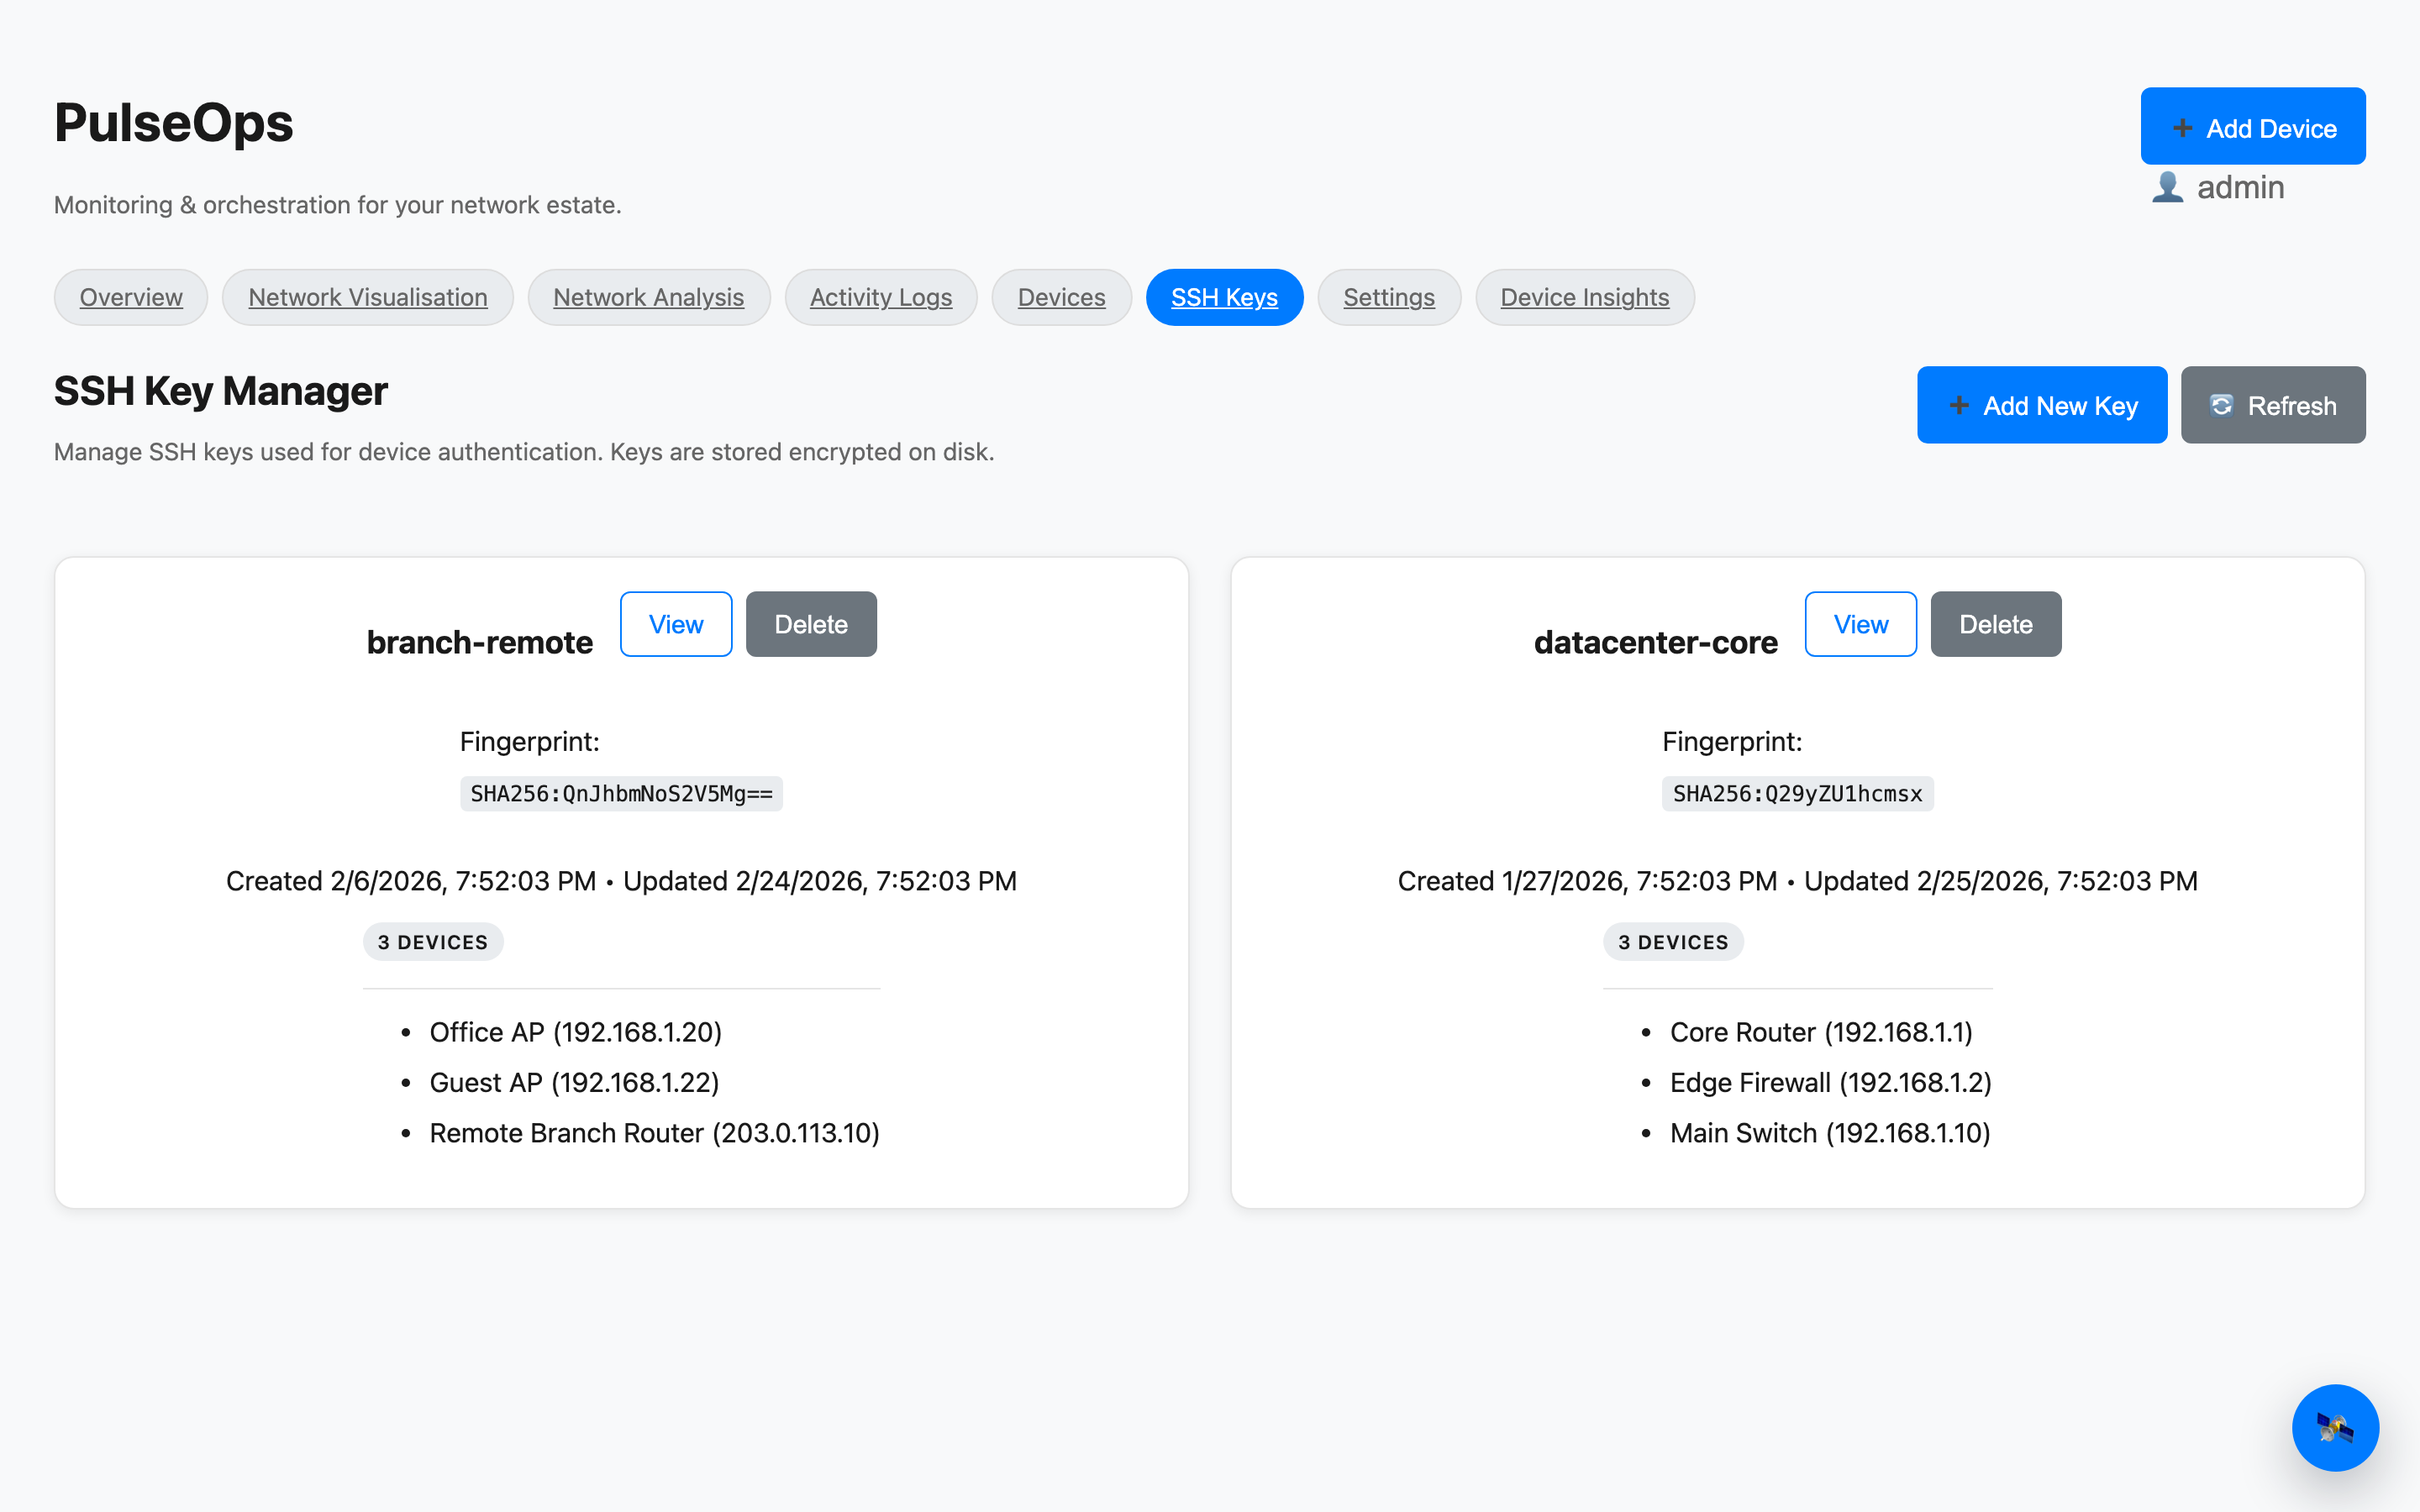
05 — Security + Keys
SSH key manager
SSH Key Manager — Add, view, and remove SSH keys with per-key usage tags. Private keys stored encrypted on disk, never exposed in the UI.
Home Docs Product UI
(c) PulseOps